The recovery of housing demand through the lens of the Consumer Expectations Survey
Published as part of the ECB Economic Bulletin, Issue 7/2021.
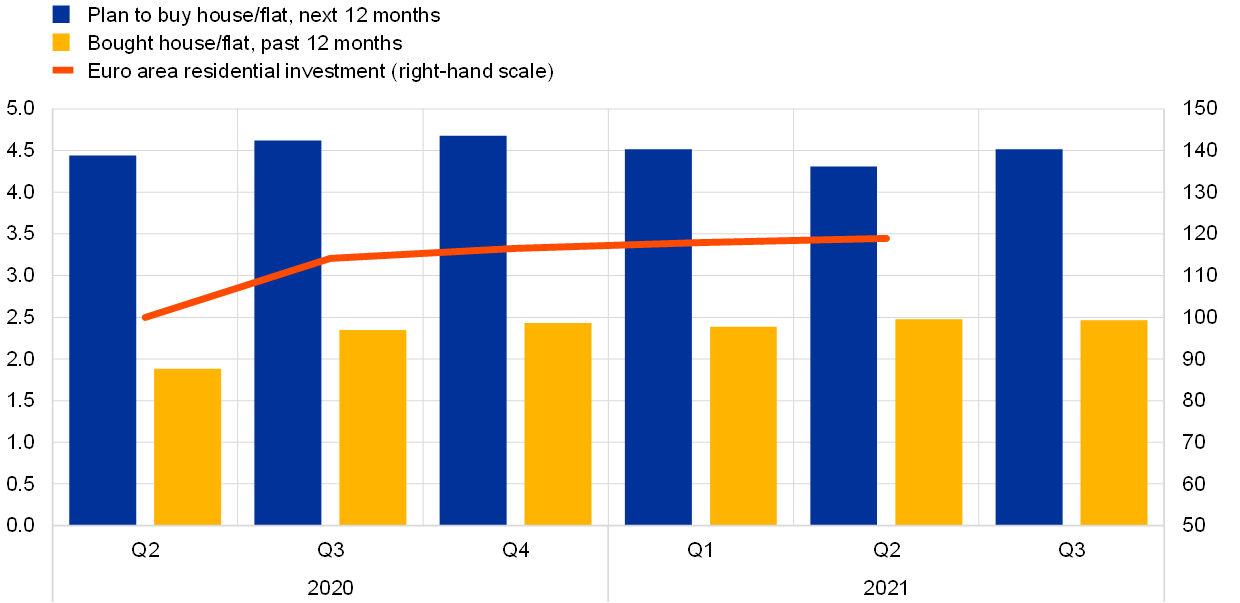
This box reports past trends and future expectations related to housing demand based on the ECB’s new Consumer Expectations Survey (CES).[2] The decisions of households to purchase a house or flat depend on many factors, including their working status and financial situation, income and wealth, and their expectations regarding the general level of prices, housing prices and mortgage credit conditions. The CES can provide micro-level insights into the purchasing decisions of households as well as some of the determining factors. For instance, the share of CES respondents who have purchased a house/flat in the past 12 months can be seen as an indicator of recent housing demand for different socioeconomic groups. Similarly, the share of respondents who intend to buy a house/flat in the next 12 months provides a forward-looking indicator of housing demand. House purchases reported by CES respondents increased between the second and third quarters of 2020 and then plateaued (Chart A, panel a). At the same time, expected purchases in the next 12 months remained relatively stable throughout the period (dark blue bars).
Chart A
Recent and expected housing demand according to CES data
a) Share of respondents who have bought a house or flat in the past 12 months or plan to buy a house or flat in the next 12 months and residential investment
(left-hand scale: percentages; right-hand scale: index: Q2 2020 = 100)

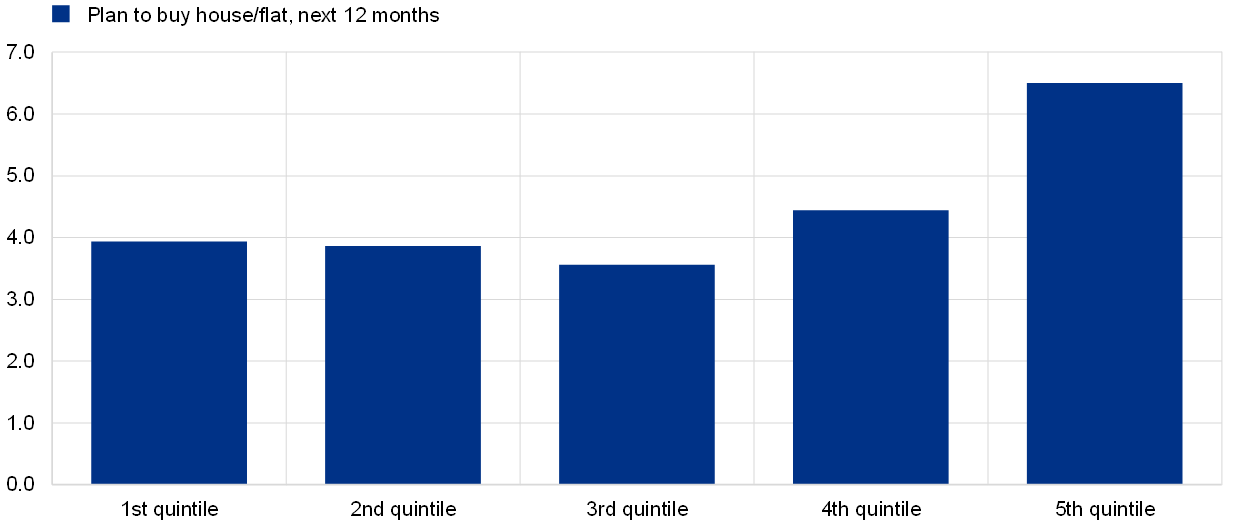
b) Share of respondents who intend to buy a house/flat in the next 12 months, by income quintile
(percentages)

Source: CES.
Notes: Weighted averages of the six largest euro area countries. Panel a: shares of respondents who replied “yes” to whether they had purchased a house or flat in the past 12 months or whether they intend to buy a house or flat in the next 12 months. Quarterly averages are used to smooth sample composition effects as the sample is relatively small. The red line shows real residential investment from the national accounts, normalised to 100 in the second quarter of 2021. Panel b: shares of respondents planning to buy a house/flat by income quintile; averages over the period February-August 2021.
The intention to buy a house/flat differs according to household income. Households from higher income quintiles are much more likely to intend to buy a house or flat in the next 12 months than lower-income households (Chart A, panel b) and are therefore likely to provide stronger support for housing demand. Moreover, these households are also the most likely to have actually bought a house or flat in the past 12 months. In addition to level of income, expected income dynamics also play an important role in decisions to invest in housing: respondents intending to buy a house in the next 12 months tend to have substantially higher income growth expectations than those who do not intend to do so.
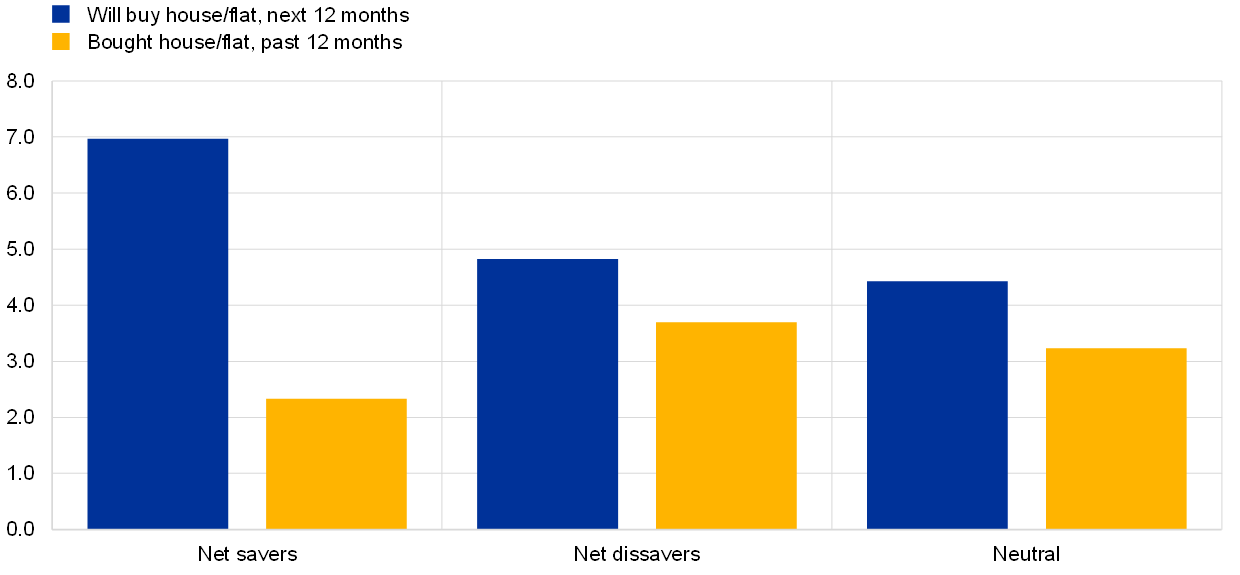
While accumulated savings are likely to have already been used for house purchase, these may still boost housing demand over the near term. The amount of accumulated savings, or savings behaviour in general, can have an impact on the decision to purchase a house or flat. In March 2021, the CES collected information about respondents’ accumulated savings since the beginning of the coronavirus (COVID-19) pandemic, distinguishing between net savers, net dissavers, and a neutral category (those who have saved approximately as much as they have dissaved).[3] An analysis of these data shows that net dissavers generally had the highest share of home buyers in the past 12 months (Chart B, panel a). When also asked about the reasons for dissaving, 36% of dissavers indicated that “An increase in my household spending because of a major purchase that I/we had planned for (e.g. house, car, etc.)” had been important or very important. This suggests that, at least to some extent, accumulated savings may have already been used for house purchases by March 2021, and some households are net dissavers because they have paid for house purchases. Looking forward, net savers had the highest share of expected house buyers. Hence, although some transactions driven by excess savings during the pandemic may have already materialised, the large stock of accumulated savings may still boost housing demand over the near term. About 44% of net savers declare that “a desire to put aside enough money to make a major purchase in the future (e.g. house, car, etc.)” has been an important or very important reason for accumulating savings since January 2020.
Chart B
The link between savings, housing demand and housing attractiveness
a) Intention to buy a house by saving category, March 2021
(percentages)

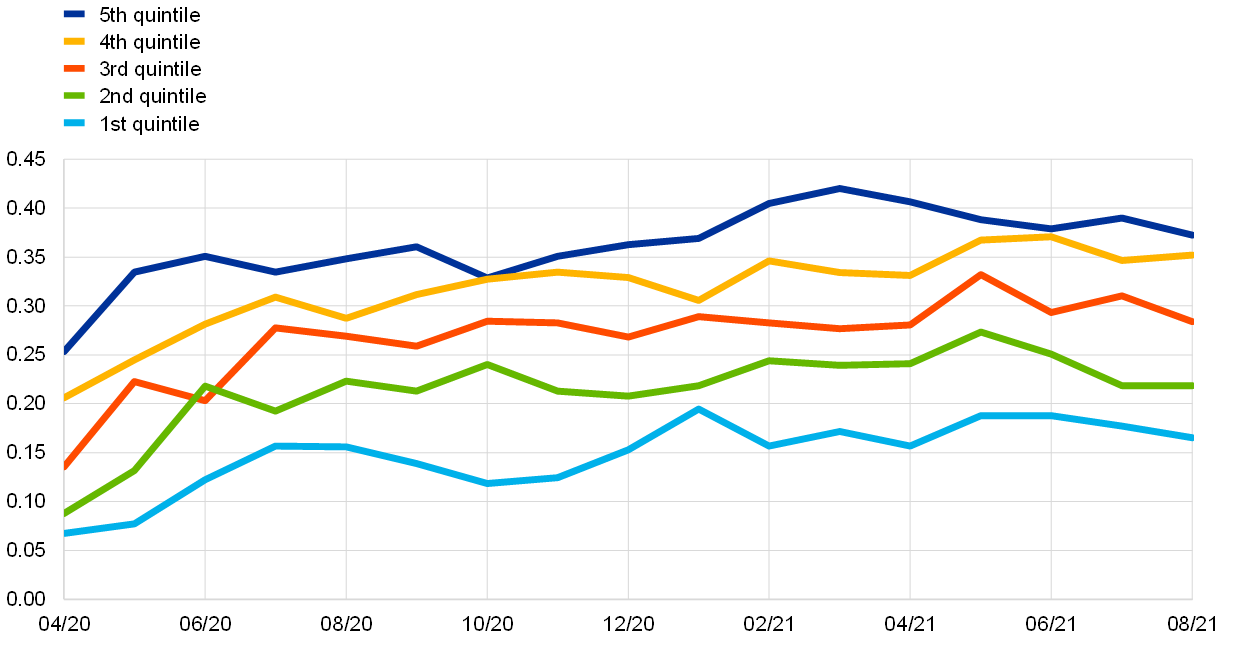
b) Attractiveness of housing as an investment by income quintile
(balance indicator)

Source: CES.
Notes: Balance indicator calculated as the sum of “good” and “very good” responses minus the sum of “bad” and “very bad”, divided by the number of respondents in the respective group. Weighted average of the six largest euro area countries.
The attractiveness of housing as an investment has increased since the start of the pandemic and remains high, particularly for households in the higher income quintiles. A useful indicator of potential housing demand for investment purposes is the degree of attractiveness of housing as an investment in the respondents’ own neighbourhood, which is measured on a five-step scale. The balance indicator for housing attractiveness rose across all income categories over the survey period, before levelling off in spring 2021. The increase was particularly pronounced among respondents in the highest income quintiles (Chart B, panel b).[4]
Expectations for credit conditions and housing prices point to a dynamic housing market. As factors increasing housing demand, CES respondents pointed to, among other things, expectations of easier access to credit in the future and declining mortgage rates. At the same time, in the period between April 2020 and May 2021, respondents almost continuously increased their expectations for house price growth. This suggests continued strong demand in the housing sector but also possible affordability issues for the lower income quintiles, as expected growth in housing prices has been much stronger than expected growth in household income and the general price index.
- The author would like to thank Pedro Neves, Niccolò Battistini, Johannes Gareis, Virginia di Nino and Moreno Roma for their input and comments.
- More detail on the CES is available in “ECB Consumer Expectations Survey: an overview and first evaluation”, Occasional Paper Series, ECB, forthcoming.
- The descriptions are based on the following response options in the questionnaire: net savers – “the household has added more money than it has withdrawn since January 2020”; net dissavers – “the household withdrew more money than it added”; and neutral – “the household added as much money as it withdrew”. The responses of non-savers – “the household has neither added nor withdrawn money” and “we do not have any money in savings or financial investments” – are less relevant for the purposes of this box and are not considered.
- The choice of neighbourhood is likely to depend on income, so higher-income households are likely to invest in higher-quality neighbourhoods, which in turn makes them a better investment.


