Published as part of the ECB Economic Bulletin, Issue 7/2022.
The effects of the recent increase in euro area HICP inflation significantly differ for low and high-income households. This box explores how recent high inflation levels are affecting low-income and high-income households differently in two main areas: their effective inflation rate due to different spending patterns, and their ability to buffer cost of living increases through savings or borrowing. The gap between the effective inflation rates experienced by those in the lowest and highest income quintiles, calculated using data on household consumption patterns, is at its greatest since 2006. Additionally, low-income households consume a larger share of their income, save less and are more liquidity-constrained than high-income households; they therefore have less room to buffer sharp increases in their cost of living through savings.
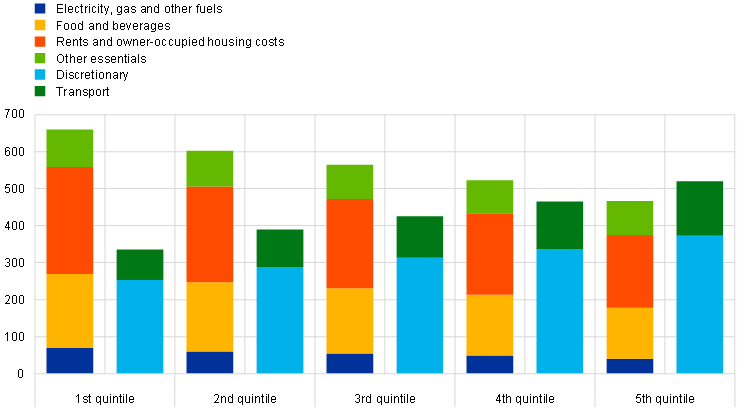
Consumption baskets vary across income groups, with low-income households spending proportionally more on essentials. Low-income households in the euro area spend a higher proportion of their total consumption expenditures on food, electricity, gas and heating and a lower proportion on transport[1], recreation, restaurants and household goods relative to high-income households (Chart A). The income-specific consumption baskets reported in the Eurostat Household Budget Survey (HBS) allow effective inflation rates to be calculated by income quintile. As “owner-occupied housing costs” are not covered by the HICP, both owner-occupied housing costs and rents were excluded from the calculations of quintile-specific effective inflation rates in this box to avoid distortions due to composition effects in measuring the cost of housing across income classes.[2]
Chart A
Euro area consumption baskets for 2015 by income quintile
(share of total expenditure, scaled to 1,000)
Sources: Eurostat Household Budget Survey, ISTAT and ECB calculations.
Notes: “Other essentials” includes expenditures on health, communications, education, water supply and services relating to housing. “Discretionary” includes clothing and footwear, furnishings, household equipment and routine household maintenance, recreation and culture, restaurants and hotels, miscellaneous goods and services, and the maintenance and repair of the dwelling. Bars are ordered by income quintile, with the lowest quintile on the left.
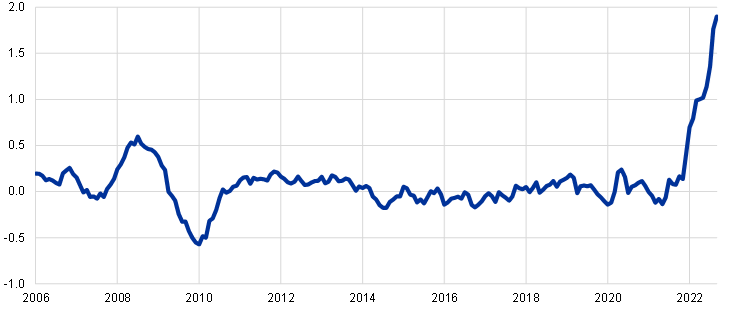
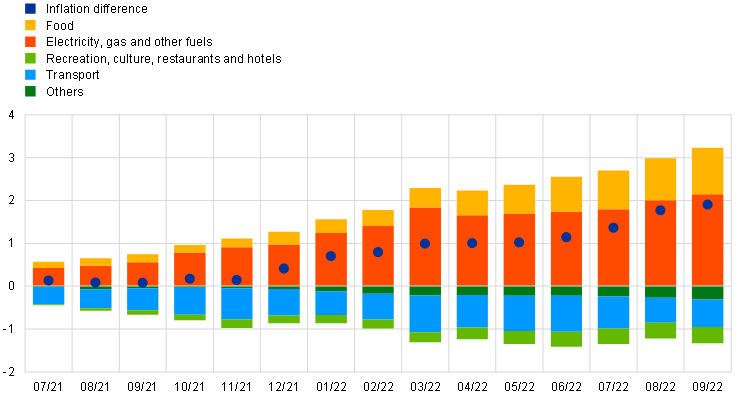
The difference between the effective inflation rate in the lowest and highest income quintiles is currently at its greatest since 2006. Between 2011 and November 2021, the gap has mostly remained small, fluctuating between -0.25 and 0.25 percentage points, which also reflected the low inflation environment. However, it increased sharply from 0.1 percentage points in September 2021 to 1.9 percentage points in September 2022 (Chart B).[3] This inflation gap between poorer and richer households is mainly driven by energy and food prices. Decomposing the inflation gap, “electricity, gas and other fuels” and, increasingly, food prices are the main drivers of the higher inflation faced by lower-income households. However, the energy price increase embedded in higher transport prices (which includes petrol and diesel, but also flights for tourism) mitigates this gap (Chart C). In addition, richer households tend to consume more expensive varieties of items within the same goods category (for example, buying branded products instead of cheaper white-label products). These differing shopping behaviours also highlight that high-income households have another avenue available to reduce their spending – by substituting expensive products with cheaper alternatives – whereas low-income households tend to already buy cheaper varieties and are thus less able to buffer the impact of inflation through substitution. However, the calculations in Chart B do not account for these substitutions.
Chart B
Inflation difference between the lowest and highest income quintile households in the euro area
(percentages)
Sources: Eurostat Household Budget Survey, ISTAT and ECB calculations.
Notes: Chart B shows the difference between the effective inflation rates for low-income households (first quintile) and high-income households (fifth quintile). Quintile-specific inflation rates are calculated based on quintile-specific consumption baskets (Chart A) excluding spending on “rents and owner-occupied housing costs”. Weights based on the HBS are updated annually in line with updates to the official HICP weights.
Chart C
Decomposition of the inflation difference between the lowest and highest income quintile households
(percentages)
Sources: Eurostat Household Budget Survey, ISTAT and ECB calculations.
Notes: The contributions of individual components are calculated as the component-level inflation rate multiplied by the difference in the weights of the component in the quintile-specific consumption baskets. Quintile-specific inflation rates are calculated excluding spending on “rents and owner-occupied housing costs”. Weights based on the HBS are updated annually in line with updates to the official HICP weights.
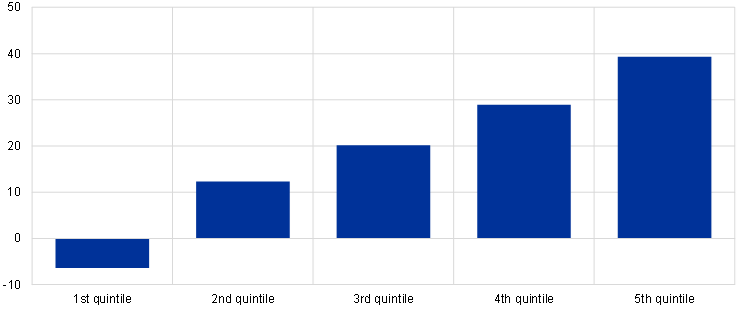
Low-income households also have less room to buffer sharp increases in their cost of living through savings. They tend to consume a larger share of their income, save less and face liquidity constraints more often than high-income households. Data from the 2017 wave of the Household Finance and Consumption Survey (HFCS) show that households at the bottom of the income distribution have the lowest median value of liquid financial assets, whereas households in the top income percentiles have the highest (Chart D, panel a). This means that low-income households have a lower capacity to absorb sharp, inflation-driven increases in living costs. In addition, the median saving rate as a percentage of household disposable income increases in higher income quintiles. Low-income households dissave, with a median saving rate of -6.4% at the bottom income quintile, whereas those in the top income quintile save 39.3% (Chart D, panel b).
Chart D
Liquid financial assets and saving rates of households in the euro area
a) Liquid financial assets
(x-axis: income percentiles, y-axis: median value of liquid financial assets in EUR thousands)
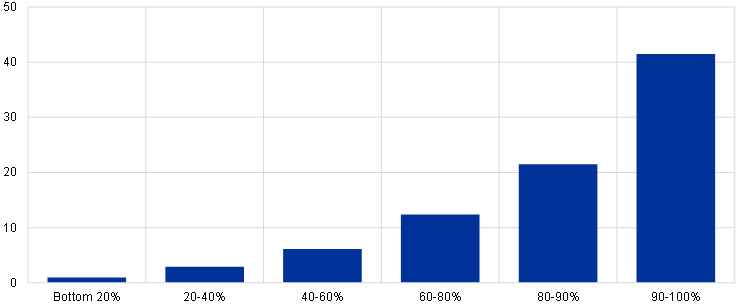
b) Saving rates
(x-axis: income quintiles, y-axis: saving rate as a percentage of disposable income)
Sources: Household Finance and Consumption Survey (2017 wave) and Eurostat experimental data for 2015.
Notes: Liquid financial assets include deposits, mutual funds, bonds, value of private business (excluding self-employment), publicly traded shares and managed accounts. Medians are conditional and are calculated among households in the euro area owning any sort of liquid financial asset (panel a). Median saving rates are calculated as a percentage of disposable income (panel b).
The higher incidence of liquidity constraints experienced by poorer households is reflected in the rise in households expecting to make late payments on their utility bills. Evidence based on the ECB’s Consumer Expectations Survey (CES) indicates that, for the same increase in energy spending, the reduction in savings for households in the lowest income quintile is more than five or six times greater than for households in the highest income quintile.[4] In this respect, a salient piece of information from the CES is that the proportion of consumers who expect to be late in paying their utility bills has risen more for low-income households than for high-income households since April 2020 (Chart E). This could mean that the financial stability of low-income households is even more threatened, given the inflationary pressures on energy and food prices.
Chart E
Proportion of consumers expecting to pay utility bills late
(percentage of respondents)

Sources: Consumer Expectations Survey and ECB calculations.
Notes: Chart E shows the proportion of CES respondents that expected to pay utility bills late in the three months immediately after the relevant survey date (between April 2020 and July 2022) across the five income quintiles.
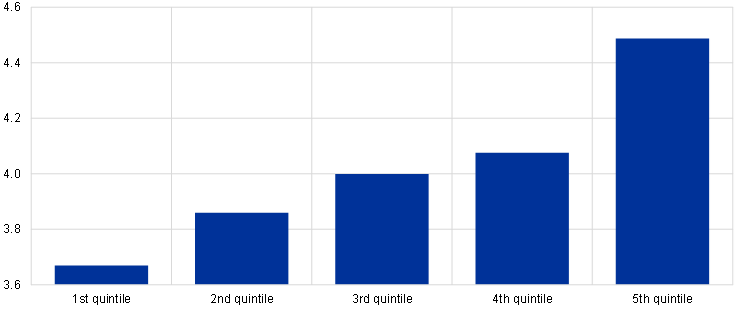
Low-income households perceived the recent government measures aimed at easing the impact of higher energy prices as less adequate than high-income households did. The CES asked respondents to what extent they perceived these measures as sufficient to maintain their usual essential spending on goods and services. The average government intervention adequacy score was lowest for the bottom income quintile and highest for the top income quintile (Chart F). This may suggest that there is scope for more effectively targeting government measures towards low-income households.
Chart F
Perceived adequacy of government intervention to combat higher energy prices
(perceived adequacy of intervention on a scale of 0 to 10)
Sources: Consumer Expectations Survey and ECB calculations.
Notes: Chart F shows the average government intervention adequacy score across the five income quintiles. The question was formulated as follows: “Many governments are currently taking measures to ease the burden on households of higher energy prices. To what extent do you think that the measures in your country will be sufficient to maintain your household’s usual spending on goods and services?” The question was asked in October 2022.
Scale: 0 = completely insufficient, 10 = fully sufficient.
Inflation in energy and food prices has major distributional effects across low and high-income households. Low-income households are more vulnerable to these price shifts, as they spend a higher proportion of their total consumption expenditure on essentials such as food, electricity, gas and heating, tend to save less and are more subject to liquidity constraints. Euro area governments have taken measures to cushion the impact of recent inflation on households, but so far all income groups perceive these measures as insufficient – especially low-income households. This indicates that there is room for improvement in the way that support measures are targeted towards low-income households.
In Chart A, “Transport” includes spending on motor vehicles, transport fuels (petrol and diesel) and transport services (e.g. domestic and international flights and train travel). As such, it contains some essential expenditures such as for commuting, as well as discretionary ones such as for holiday flights.
When calculating income quintile-specific inflation rates, the raw weights reported in the HBS are not directly used, but are adjusted in line with the methodology for the HICP. As the HICP does not include owner-occupied housing, the HBS item “rents and owner-occupied housing costs” is excluded. In addition, the weights are adjusted as follows: for a given two-digit classification of individual consumption by purpose (COICOP) item quintile weight, the difference between the item weight used for the HICP calculation and the aggregate item weight from the HBS is added on an annual basis. Furthermore, the item “Housing, water, electricity, gas and other fuels” is not entered as a COICOP two-digit series; instead three-digit series are used (excluding rents and owner-occupied housing). For information on the exclusion of owner-occupied housing from the HICP, see Work stream on inflation measurement, “Inflation measurement and its assessment in the ECB’s monetary policy strategy review”, Occasional Paper Series, No 265, ECB, Frankfurt am Main, September 2021.
As mentioned above, the expenditure weights reported in the HBS include expenditures on owner-occupied housing (in addition to rents), which differ significantly across income groups. As the HICP does not include owner-occupied housing, the calculation method used here for income-specific inflation rates excludes “rents and owner-occupied housing” from the quintile-specific consumption baskets. If the “raw” weights reported in the HBS are used instead and changes in the HICP weights over time are not accounted for, this gap increases to 2.3 percentage points (1.8 percentage points when housing costs are included) for September 2022.
See the article entitled “Energy prices and private consumption: what are the channels?”, Economic Bulletin, Issue 3, ECB, 2022.


