


Published as part of the ECB Economic Bulletin, Issue 5/2023.
Developments in underlying inflation are a key input for the ECB’s monetary policy assessment. In making monetary policy decisions in an environment of elevated uncertainty, the ECB’s Governing Council has stressed the need to pay particularly close attention to the implications of the incoming data for the inflation outlook, developments in underlying inflation, and the strength of monetary policy transmission.[1] Underlying inflation measures should capture more persistent and generalised developments across prices, abstracting from volatile or idiosyncratic relative price movements, and thereby provide an informative signal about where headline inflation will settle in the medium term. Ideally, such measures should have a sound theoretical grounding, economic interpretability and be easy to communicate to the public.
Practitioners and theorists apply different definitions to underlying inflation, so clarifications are warranted. Sometimes the term “underlying inflation” is used interchangeably with the notions of “core inflation” and “trend inflation”. In the ECB’s economic analysis, the concepts of underlying inflation and trend inflation are distinguished by the horizon over which shocks dissipate. Conceptually, underlying inflation reflects medium-term inflation developments linked to the business cycle, whereas trend inflation captures more persistent, longer-term components related to structural factors. At the ECB, core inflation refers to the Harmonised Index of Consumer Prices (HICP) excluding energy and food. As this excludes the volatile energy and food components that are subject to frequent transitory shocks, it is also considered to be a specific measure of underlying inflation.
Underlying inflation is unobservable, so the ECB hedges against this intrinsic uncertainty by monitoring a range of measures.[2] Underlying inflation is a theoretical concept and needs to be estimated. All the estimated measures seek to filter out the more transitory component of inflation and can be categorised into three broad estimation approaches. Permanent exclusion-based measures exclude certain fixed items that tend to be more volatile, such as energy or food. Temporary exclusion-based measures remove items that exhibit more volatile dynamics in certain months, on a time-varying basis. Model-based measures rely on economic relations to capture the persistent component of inflation in a theoretically more rigorous manner. Each of these approaches is included in the ECB’s comprehensive assessment of inflation. Table A lists some of the key measures that are monitored at the ECB and evaluated in this box.[3] The set of indicators is regularly reviewed and updated.
Table A
Definitions of key underlying inflation indicators at the ECB

Source: ECB.
1) See the box entitled “A new indicator of domestic inflation for the euro area”, Economic Bulletin, Issue 4, ECB, 2022.
2) The PCCI captures the common and persistent components from the European classification of individual consumption according to purpose (ECOICOP) four-digit classes of HICP items from 12 euro area countries (around 1,000 series); for the PCCI excluding energy, only common components of non-energy items are aggregated. It uses a dynamic factor model to filter out idiosyncratic and transitory developments in individual HICP items and aggregates the resulting common components using HICP weights. See Bańbura, M. and Bobeica, E., “PCCI – a data-rich measure of underlying inflation in the euro area”, Statistics Paper Series, No 38, ECB, October 2020.
3) See Box 2 in “Measures of underlying inflation for the euro area”, op. cit.
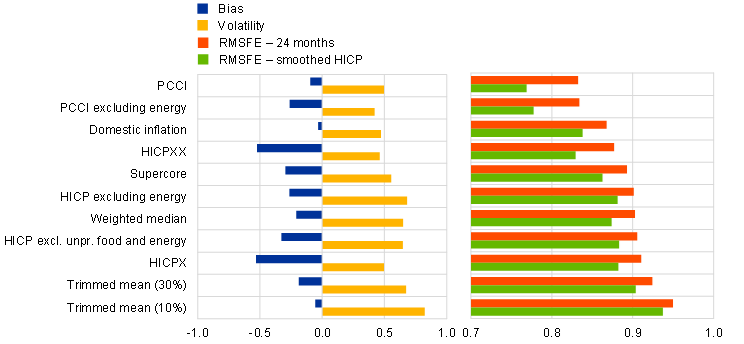
Empirically, most measures of underlying inflation provide a useful signal for medium-term headline inflation developments in the euro area. Their desirable properties are usually assessed against a set of statistical criteria that test whether a measure is less volatile than headline inflation, is an unbiased estimator of it and has some out-of-sample predictive power for medium-term inflation.[4] All measures of underlying inflation are less volatile than headline inflation because they remove some of the noise affecting the headline rate (yellow bars in Chart A). For most of these measures, the long-term average is lower than that of headline inflation, meaning they are somewhat biased indicators (blue bars in Chart A). This is because, over the available sample period for the euro area, volatile components such as energy and food were mostly subject to upside shocks and grew faster than the other components. The current value of the underlying inflation measures provides, on average, a better medium-term forecast of the future headline rate than the current value of the headline rate itself.[5] This is indicated by the measures’ root mean squared forecast error (RMSFE) with respect to future inflation 24 months ahead relative to that of headline itself (red bars in Chart A). The same holds when predicting a smoother version of headline inflation, proxied here by a centred two-year moving average (green bars in Chart A).[6] A few measures tend to perform well across the criteria, namely the PCCI measures, domestic inflation and HICPXX. These exhibit the lowest volatility and achieve the lowest RMSFE.[7]
Chart A
Properties of underlying inflation measures
(bias: percentage points; volatility: standard deviation; RMSFE: no units)
Sources: Eurostat and ECB calculations.
Notes: The bias is the average contemporaneous difference vis-à-vis headline inflation. Volatility is the standard deviation of each measure divided by the standard deviation of headline inflation. RMSFE 24 months and RMSFE smoothed HICP are the root mean squared forecast errors of each measure with respect to headline inflation 24 months ahead and the two-year centred moving average of inflation covering two-years of future data, respectively, divided by the RMSFE of headline inflation. A number lower than one indicates that the measure performs better than headline inflation. The sample covers the period from April 2001 to June 2023. For definitions of the indicators, see Table A.
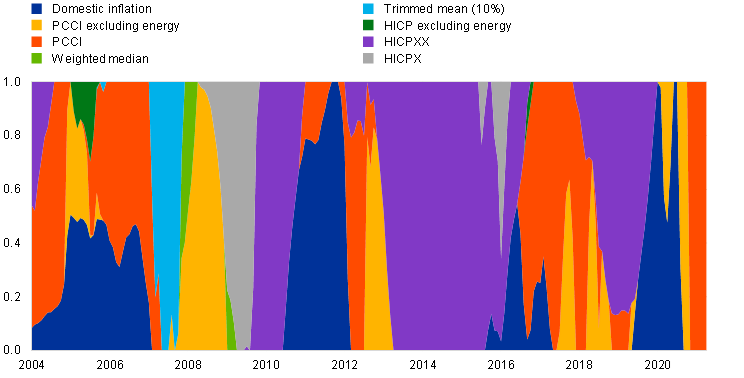
The relative forecasting performance of the different measures varies over time, but the PCCI measures, domestic inflation and HICPXX tend to perform better. This is confirmed when employing a forecast combination algorithm designed to minimise the two-year ahead RMSFE. Over time, the algorithm tends to pick one or more of these measures (Chart B). At the same time, certain permanent exclusion-based indicators and trimmed indicators are consistently absent from the optimal forecast combination, suggesting that these do not provide useful signals over and above those provided by other measures. It is worth noting that while HICPXX scores well in terms of RMSFE, it does have a rather large negative bias, as shown in Chart A.
Chart B
Underlying inflation measures selected in an optimal forecast combination
(weight assigned to minimise the RMSFE 24 months ahead over a three-year rolling window)
Source: ECB staff calculations.
Notes: Optimal weights for combining the 11 underlying inflation measures described in Table A to forecast headline inflation 24 months ahead. The latest observations are for June 2021 (corresponding to the forecast for the June 2023 HICP).
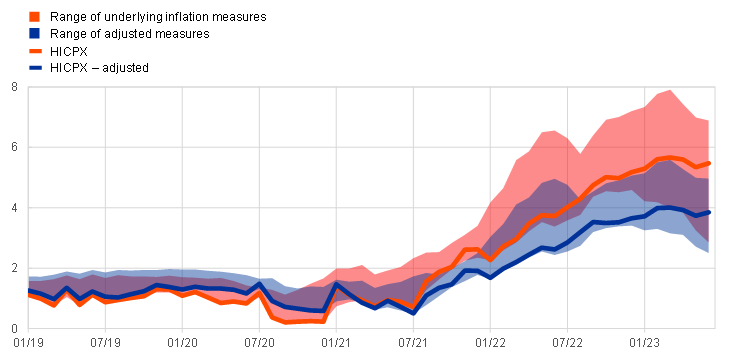
As a result of recent major economic dislocations, a sizeable and possibly more slowly reverting transitory element is now embedded in underlying inflation measures, rendering them less informative for the medium term. The surge in inflation since the middle of 2021 has been the product of extraordinary relative price shocks related to the post-pandemic recovery, supply bottlenecks and the rise in energy prices linked in part to Russia’s war against Ukraine. These shocks turned out to be larger and their effects possibly more persistent than in the past. In this context, standard measures of underlying inflation may contain a sizeable “reverting” component that can be expected to fade out over the medium term.[8] One way to adjust for the impact of these exceptional shocks is to use a model to assess their impact on inflation over the last few years. Chart C shows a counterfactual underlying inflation range based on such a model when energy shocks (oil supply, oil-specific demand and gas price shocks) and shocks linked to global supply chain disruptions are filtered out as far as possible.[9] This indicative filtering-out of the energy and supply bottleneck shocks shifts down and narrows the range of underlying inflation measures, reflecting the sizeable contribution of these shocks in the current measures. Eliminating other transitory shocks – such as reopening effects and the shocks driving a significant part of the recent rise in food prices – or allowing for possible non-linear effects would shift the range even lower. Similarly, if part of the energy and supply bottleneck shocks also generated medium-term inflation pressures, this would shift the range upwards.
Chart C
Range of underlying inflation measures and measures adjusted for impact of supply bottleneck and energy shocks
(annual percentage growth)
Sources: Eurostat and ECB staff calculations.
Notes: Adjustments based on Bańbura, M., Bobeica, E. and Martínez Hernández, C., “What drives core inflation? The role of supply shocks” (forthcoming) using a large BVAR model accounting for many drivers of inflation (17 variables), identified with zero and sign restrictions and estimated from January 1995 to June 2023. The latest observations are for June 2023.
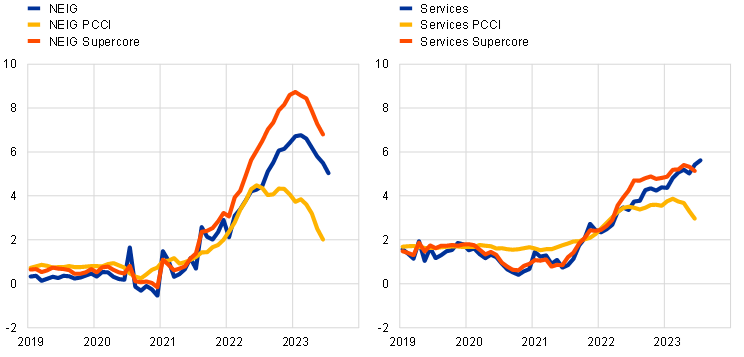
Domestic inflationary forces are becoming more prominent, while external pressures are to a large extent softening. Distinguishing between services and goods inflation can help to gauge the persistent component in inflation, particularly following the pandemic. Goods were more affected by supply bottlenecks and were subject to relatively higher demand during the pandemic. As a result, non-energy industrial goods (NEIG) inflation, which accounted for around 20% of HICPX before the pandemic, contributed around half of it at the beginning of 2023. With the supply bottlenecks and the pandemic-related surge in goods demand fading out, goods inflation is less likely to be persistent, whereas the dynamics of services inflation may determine the overall persistence of headline inflation.[10] PCCI and Supercore calculated separately for NEIG and services also confirm that the recent easing of core inflation is mainly driven by the NEIG component rather than services. However, the PCCI, which is, by construction, better at capturing the momentum of a series, appears to have started to decline for services too (Chart D).
Chart D
Goods and services inflation
(annual percentage growth; PCCI: three-month moving average of annualised month-on-month growth rates)
Sources: Eurostat and ECB calculations.
Note: The latest observations are for June 2023 for PCCI and Supercore and July 2023 for NEIG and services inflation.
Although most measures are showing signs of easing, underlying inflation remains high overall. The indicators stood between 2.9% (PCCI) and 6.9% (HICP excluding energy) in June. The measures that have ranked highly against the set of criteria for signalling medium-term headline inflation developments (PCCI measures, HICPXX and domestic inflation) lie in the lower half of the range (darker shaded area in Chart E). Median and mean underlying inflation measures suggest that underlying inflation likely peaked in the first half of 2023, particularly when looking through the upward base effect caused by the introduction of the 9 euro ticket in Germany in June 2022.[11] The estimates of the adjusted indicators, which ranged from 2.5% to 5.0% in June, also show some signs of easing. However, the range of the underlying inflation measures remains much wider than before 2022, which suggests there is still a high degree of uncertainty as to the level of underlying inflation. At the same time, the easing of underlying inflation comes with an ongoing shift in inflationary forces from external to domestic sources. This is notably reflected in the divergent dynamics of the PCCI, which is falling fast – in part due to its sensitivity to the rapid fall in energy prices – and the domestic inflation indicator, which has not yet shown any sign of deceleration.[12]
Chart E
Indicators of underlying inflation and the best performing indicators
(annual percentage growth; PCCI and PCCI excluding energy: three-month moving average of annualised month-on-month growth rates)
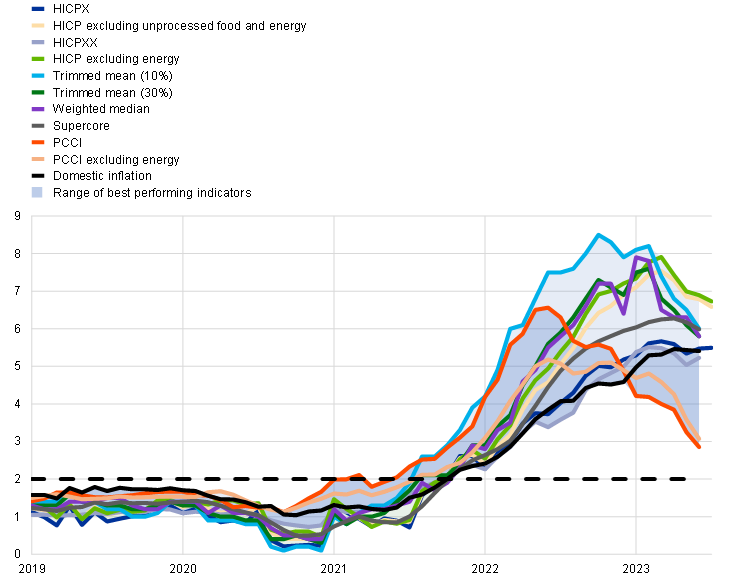
Sources: Eurostat and ECB calculations
Notes: The darker shaded area covers the PCCI measures, HICPXX and domestic inflation. The latest observations are for July 2023 for HICPX, HICP excluding unprocessed food and energy and HICP excluding energy and June 2023 for the rest.
Underlying inflation measures are updated with each HICP release and developments need to be carefully assessed against the inflation outlook on a regular basis. Along with underlying inflation and indicators of monetary policy transmission, incoming data – also in the form of projection errors and special factors, such as base effects – can provide valuable information on the risks to medium-term inflation. In this respect, the additional data point provided by the flash estimate for HICP inflation in July confirms the assessment of underlying inflation developments (Chart E). In particular, HICPX, which stands at 5.5%, remained broadly unchanged rather than declining. This was expected given the distorting base effects mentioned above.
Continuously monitoring underlying inflation can help in assessing whether the latest Eurosystem/ECB staff macroeconomic projections are on track, especially in an environment of elevated uncertainty. In the current situation, the mostly stable or decreasing path of underlying inflation indicators from their high levels is broadly in line with the inflation outlook in the latest Eurosystem staff macroeconomic projections. The disinflationary path in these projections is consistent with the fading-out of the reverting component – connected to the last year’s surge in energy prices and pandemic-related supply bottlenecks – that had contributed to the sharp increases in underlying inflation measures. The differences across the range of underlying inflation measures are also in line with the assessment in the June projections that the external drivers of inflation should fade out, with the dynamics of domestic components of inflation determining the overall persistence of the inflation process. This assessment underlines the value of complementing the tracking of underlying inflation measures with close monitoring of the factors that are likely to determine domestic price pressures over the medium term, notably the incoming data on wages, profits and inflation expectations.
See Lane, P. R., “Underlying inflation”, lecture at Trinity College Dublin, 6 March 2023 and Lagarde, C., “Monetary Policy Statement”, 4 May 2023. For an introduction to the analysis of underlying inflation at the ECB, see the article entitled “Measures of underlying inflation for the euro area”, Economic Bulletin, Issue 4, ECB, 2018. The importance of underlying inflation for monetary policy decision-making was highlighted in the ECB’s 2021 monetary policy strategy review.
This box focuses on underlying inflation measures that are based on (disaggregated) HICP data. However, a large set of additional variables containing information about medium-term price pressures is also assessed regularly. These include wage, profit and inflation expectation indicators as well as high-frequency indicators such as wage trackers and surveys.
For more details, see “Measures of underlying inflation for the euro area”, op. cit. and Lane, P. R., “Inflation Diagnostics”, The ECB Blog, 25 November 2022.
Headline inflation tends to lead most measures of underlying inflation (including core) as it captures energy shocks more directly, whereas underlying inflation measures do so with a delay owing to indirect effects. However, these measures can still be indicative of where inflation will settle in the medium term.
This corresponds to a “random walk forecast”, i.e. the forecast is the same as the current value.
The last evaluation of the underlying inflation indicators was carried out as part of the monetary policy strategy review in 2021. See “Inflation measurement and its assessment in the ECB’s monetary policy strategy review”, Occasional Paper Series, No 265, ECB, September 2021.
It should be noted that data revisions are not taken into account in the analysis. This is particularly relevant for the PCCI. As a model-based measure, it is revised as new data become available and the model parameters are re-estimated, but the direction is generally robustly estimated. In a real-time setting, the performance of the PCCI deteriorates, but it remains competitive compared with other measures of underlying inflation.
See Lane, P. R., “Underlying inflation”, op. cit.
A large Bayesian vector autoregressive (BVAR) model identified with zero and sign restrictions is used to decompose the underlying inflation measures into contributions from various shocks following the methodology of Korobilis and estimated from January 1995 to June 2023. See Korobilis, D., “A new algorithm for structural restrictions in Bayesian vector autoregressions”, European Economic Review, Vol. 148, September 2022; and Bańbura, M., Bobeica, E. and Martínez Hernández, C. “What drives core inflation? The role of supply shocks” (forthcoming). In the counterfactual scenario, the contribution of the oil supply, oil-specific demand, gas price and supply bottleneck shocks is set to zero. One caveat to this in the present context is that the impact of these shocks may also include persistent elements that also remain over the medium term. The counterfactual range is based only on those underlying inflation measures for which a seasonally adjusted index was available; trimmed means are not considered.
Other major central banks have also been focusing on services inflation recently. In the United States, the services category is further broken down into housing services and core services other than housing. The latter “may be the most important category for understanding the future evolution of core inflation”. See Powell, J. H., “Inflation and the Labor Market”, speech at the Hutchins Center on Fiscal and Monetary Policy, Brookings Institution, Washington, D.C., 30 November 2022.
This had a downward impact on travel services prices between June 2022 and September 2022 and increased the year-on-year growth rate of these items in June 2023. Several measures, in particular those at the higher end of the range and the permanent exclusion-based measures, are distorted by this base effect.
Unlike most other measures of underlying inflation, the PCCI does not a priori exclude energy, just its estimated transitory component. The PCCI measures are estimated based on the more timely month-on-month rate of change of prices, whereas the other measures are expressed as year-on-year growth rates and tend to lag somewhat. This timeliness makes the PCCI better placed to capture the momentum of inflationary pressures.