


Published as part of the ECB Economic Bulletin, Issue 3/2024.
In recent quarters, euro area households have been faced with higher housing costs, including mortgage costs. According to the ECB Consumer Expectations Survey, in the years since the outbreak of the COVID-19 pandemic and amid the surge in energy prices, households in the eleven largest euro area countries have seen rising housing costs, including expenditure on rent or higher mortgage interest payments, home maintenance and utilities (such as gas, electricity and water).[1] Chart A, panel a), shows the dynamics of the overall monthly housing-related burden for outright owners, renters and mortgagors. In January 2024 households were paying an average of €765 per month in total housing-related costs, including utilities, home maintenance and rent or mortgage costs. Over the period from July 2022 – the beginning of the interest rate hiking cycle - to January 2024, the average housing costs reported in the Consumer Expectations Survey rose cumulatively by around 10.2%, compared with a cumulative rise in the Harmonised Index of Consumer Prices (HICP) of 5.5%. Additionally, the dispersion in the monthly housing costs for each of the ownership types has increased. For mortgagors in particular, the higher costs would seem to be driven by the upper end of the distribution, with the cost for the lower end remaining relatively constant. This greater dispersion might suggest heterogeneous effects across mortgagors, i.e. while households with existing fixed-rate mortgages have not, as yet, been affected significantly by the ECB’s monetary policy tightening and the successive interest rate hikes, households taking out new loans or renewing or refinancing existing mortgages are already facing increased interest rate payments.
Housing costs differ across ownership types and by country. Chart A, panel b), shows the percentage change in housing costs from July 2022 to January 2024 for all three categories of households, namely outright owners, mortgagors and renters. The overall costs have increased by around 6% for outright owners, but by 12% and 9% for mortgagors and renters respectively. Different factors are at play in each case: i) for outright owners, the change is driven by rising home maintenance costs, although utility costs have fallen slightly owing to the recent moderation of energy prices following their surge in the course of 2022; ii) for mortgagors, the primary driver has been the increase in mortgage payments attributable to higher interest rates on existing variable-rate mortgages and even more noticeably on new, renewed and refinanced mortgage loans; and iii) for renters, costs have largely followed rent developments, as well as utility price trends owing to renters’ having less flexibility in absorbing unexpected expenses[2].[3] With regard to individual euro area countries, Chart A, panel c), shows that there is significant cross-country heterogeneity in housing costs and that the difference between costs excluding mortgage payments and those including such payments is substantial, especially for countries such as Italy and Spain that tend to have a higher proportion of adjustable-rate mortgages.
Chart A
Average housing costs
a) By ownership type over time
(monthly costs in EUR)

b) Cumulative change between July 2022 and January 2024
(percentage changes; percentage point contributions)

c) By country for January 2024
(monthly costs in EUR)

Sources: ECB Consumer Expectations Survey and ECB calculations.
Notes: The calculations are based on weighted estimates. Average total housing costs comprise home maintenance and utility costs, together with rent for renter households or debt repayments for mortgagors, these costs being winsorised for each ownership type. It is assumed that for mortgagors, debt repayment primarily consists of the payment of principal and interest on mortgages. In panel b), housing costs include home maintenance and, for renters, also comprise rent. In panel c), countries are ordered by housing costs in descending order.
Since 2022 growth in household nominal income has largely offset the rise in housing costs, and the ratio of housing costs to income has therefore remained relatively stable. The housing cost ratio, defined as total housing costs divided by disposable income, has remained unchanged overall since the beginning of 2022. Chart B, panel a), shows that this is largely the case for all categories, i.e. outright owners, renters and mortgagors. Housing costs take up around 20% of disposable income for outright owners, 40% for renters and 35% for mortgagors. Nevertheless, this differs across income groups, with the housing cost ratio having increased slightly for the top 20% of earners among mortgage and renter households, but remaining fairly stable for the bottom 50% of earners. This difference reflects, on the one hand, the fact that higher-income households are more likely to take out mortgages and generally do so for larger amounts, while, on the other hand, there has been stronger income growth for lower-income households, possibly attributable in part to recent targeted income-support measures implemented by the larger euro area governments.[4] As Chart B, panel b), shows, including mortgage costs as a factor adds substantially to the average housing-related burden.
Chart B
Housing cost to income ratio
a) By ownership type over time
(percentages)

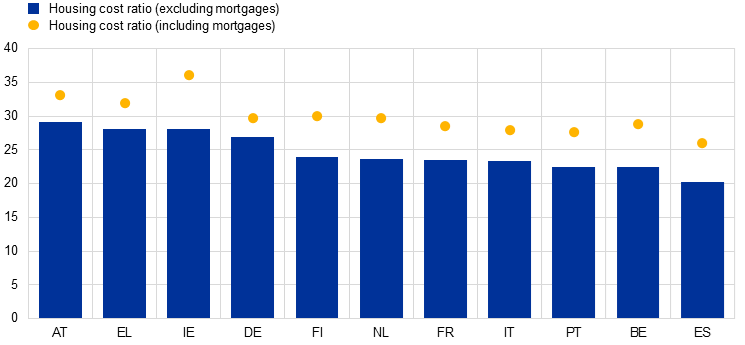
b) By country for January 2024
(percentages)
Sources: ECB Consumer Expectations Survey and ECB calculations.
Notes: The housing cost ratio is calculated at micro level for each household by dividing the housing cost by household disposable income, and the mean household housing cost ratio is then determined for each ownership type for each country. Countries are ordered by the values of the housing cost ratio in descending order.
Among lower-income groups, a substantial proportion of households are overburdened by their housing costs. According to Eurostat’s definition, households are considered to be overburdened if their total housing-related costs take up more than 40% of household disposable income. Chart C plots the proportions of overburdened households for the eleven euro area countries covered by the Consumer Expectations Survey, broken down by income quintile and ownership type. The proportions vary dramatically across income categories. In the lowest income quintile more than 60% of households are overburdened, and in particular renter households. Although the proportion of overburdened households in the higher income quintiles is substantially lower, it nevertheless encompasses about 45% of households in the second income quintile and over 20% of those in the third quintile. “Overburdened” households with a higher income are mostly mortgagors who face difficulties in paying their mortgage costs. Interestingly, the share of overburdened households in the fourth income quintile is higher than in the third, driven by mortgagors. This may reflect the fact that, in the low interest rate environment of the past, such households took out disproportionately more mortgage debt relative to their incomes.
Chart C
Share of overburdened households by income quintile for January 2024
(percentages of respondents)

Sources: ECB Consumer Expectations Survey, Eurostat and ECB calculations.
Notes: The calculations are based on weighted estimates. The overburden ratio is the proportion of households with housing costs exceeding 40% of their disposable household income and is calculated for all three ownership types. The proportion of overburdened households for each type is then stacked to obtain the total proportion of overburdened households per income quintile.
More households, and in particular lower-income households, have indicated in recent months that they expect to make late payments of their rent or mortgage and/or their utilities. Given the present and future effects of both increased interest rates and loss of purchasing power owing to inflation, the ability of households to meet their housing-related costs and mortgage payments is a source of concern, especially for lower-income households. In recent years, some 5-10% of low-income households have stated that they have made a late payment of rent or a mortgage and/or utilities in the past three months (Chart D, panel a). This percentage has remained relatively stable over time, although it decreased slightly in the first quarter of 2024. By contrast, the forward-looking indicator of late payment risk, measured as the proportion of households expecting to make a late payment in the next three months, has risen substantially among lower-income households. In the first quarter of 2024, the proportion of households expecting to make late payments for utilities or rent rose to over 20%, up from about 15% in 2023, and nearly doubled to 30% for late mortgage payments.
Housing cost ratios are positively correlated with the frequency of late payment, the strongest correlation being for mortgage and renter households. Average housing costs to income ratios differ substantially across countries, as does the frequency of late payments for households of different ownership types. The correlation is, however, strong across all ownership categories (Chart D, panel b). The increased risk of making late payments as housing costs rise is the largest for renters, who also have the highest average values for the housing cost ratio and for the probability of late payment. With regard to renters, any change in either indicator, which tends to be more prevalent for lower-income households, needs to be monitored carefully, given that this might have major consequences for both household consumption behaviour and indebtedness.
Chart D
Late payment
a) By type of late payment over time
(percentages of respondents by income)

b) By ownership type across countries
(percentages of respondents; percentages of income)

Sources: ECB Consumer Expectations Survey, Eurostat and ECB calculations.
Notes: The calculations are based on weighted estimates. In panel a), the housing cost ratio refers to the sum of the relevant cost categories (namely rent, or a mortgage, utilities and home maintenance) for each ownership type divided by disposable household income. The late payment indicator takes a value of one if a household has made a late payment in the past three months in at least one of the cost categories. Expected late payments takes a value of one if a household expects to make a late payment in the next three months in at least one of the cost categories. The values for the years 2022 and 2023 are annual averages, whereas the value for 2024 is for January only. In panel b), the housing cost ratio refers to the average ratio of total housing costs to disposable household income for the respective ownership type, calculated at micro level. Greece is excluded from the regression lines.
For general information on the Consumer Expectations Survey, see “ECB Consumer Expectations Survey: overview and first evaluation”, Occasional Paper Series, No 287, ECB, December 2021.
For more information on the varying impact of utility prices on ownership types see, for example, Carliner, M., “Reducing Energy Costs in Rental Housing – The Need and the Potential”, Research Brief, No. 13, Issue 2, Joint Center for Housing Studies of Harvard University, December 2013.
Mortgage costs account for a substantial proportion of the user cost of housing and their increase is related to the interest-rate changes of recent times. The rise seen in the user cost of housing is, however, also associated with the long-standing decline in housing investment – see Box 4, entitled “Housing investment and the user cost of housing in the euro area” in this issue of the Economic Bulletin.
See Box 5, entitled “A primer on measuring household income”, Economic Bulletin, Issue 8, ECB, 2023.