Assessing corporate vulnerabilities in the euro area
Published as part of the Financial Stability Review, November 2020.
By bringing much of the euro area economy to a temporary halt, the coronavirus pandemic has threatened the existence of many euro area firms. While liquidity shortages were seen as the major threat to non-financial corporate (NFC) health at the beginning of the pandemic, more recently firms’ solvency has become the primary concern. Without the massive monetary and fiscal support measures, many more viable firms could have been forced into failure by the impact of the pandemic, adding to pressures on the economy and banks. Against this backdrop, this box assesses euro area NFC vulnerabilities and the underlying factors.
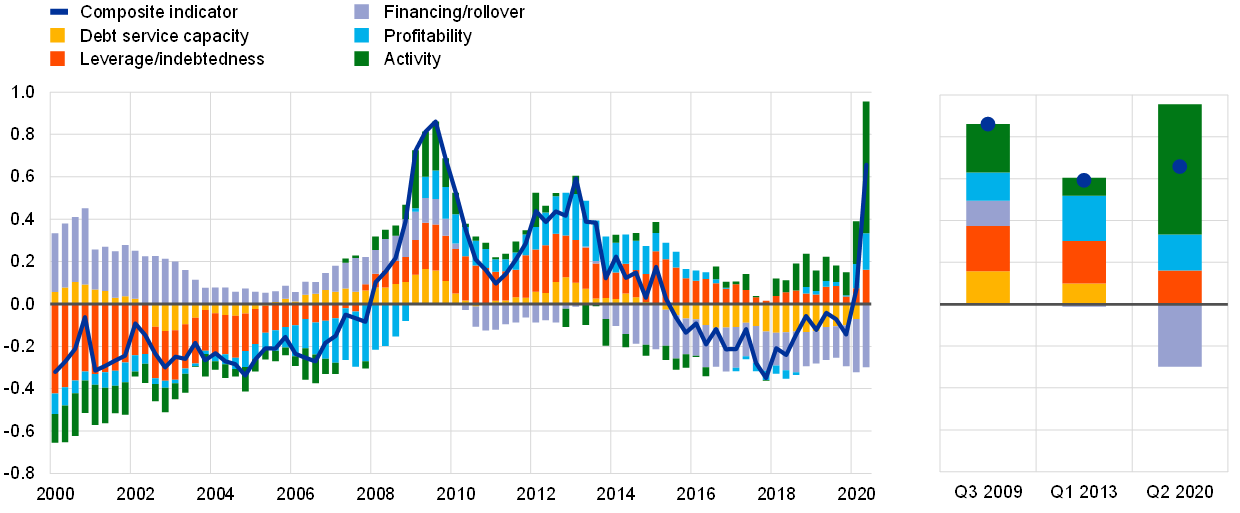
A newly developed composite indicator allows analysis of the time-varying impact and the relative importance of the factors driving corporate financial soundness and risk. Using aggregate sectoral accounts data, this measure combines indicators along five dimensions: debt service capacity, leverage/indebtedness, financing/rollover, profitability and activity. The indicators are standardised by transforming them into z-scores, with a mean of zero and unit standard deviation. Composite sub-indicators are computed for each of the five dimensions by taking the simple arithmetic average of the respective underlying z-scores of the individual indicators. Finally, the overall composite indicator is obtained by equally weighting the composite z-scores of the five sub-categories. Positive/negative values indicate higher/lower vulnerabilities.
Chart A
Vulnerabilities have increased in the euro area corporate sector in the wake of the pandemic, but unlike in previous crises, risks are currently mitigated by highly favourable financing conditions
Composite indicator of non-financial corporate vulnerabilities and contributing factors
(Q1 2000-Q2 2020, z-scores)

Sources: Eurostat, ECB, IHS Markit and ECB calculations.
Notes: The composite measure is based on a broad set of indicators along five dimensions: debt service capacity (measured by the interest coverage ratio, corporate savings and revenue generation), leverage/indebtedness (debt-to-equity, net debt-to-EBIT and gross debt-to-income ratios), financing/rollover (short-term debt-to-long-term debt ratio, quick ratio (defined as current financial assets/current liabilities), overall cost of debt financing and credit impulse (defined as the change in new credit issued as a percentage of GDP)), profitability (return on assets, profit margin and market-to-book value ratio) and activity (sales growth, trade creditors ratio and change in accounts receivable turnover). Except for the overall cost of debt financing and GDP, all indicators are based on data from the ECB’s quarterly sector accounts. The overall cost of debt financing indicator is calculated as a weighted average of the costs of bank borrowing and market-based debt, based on their respective amounts outstanding.
Corporate vulnerabilities have increased sharply in the wake of the pandemic. According to the composite indicator, corporate vulnerabilities have increased to levels last observed at the peak of the euro area sovereign debt crisis, but remain below levels reached in the aftermath of the global financial crisis (see Chart A). The deterioration in NFC financial health was largely driven by a drop in sales, lower actual and expected profitability, and an increase in leverage and indebtedness.
Extensive monetary, fiscal and prudential policy measures have limited the increase in corporate vulnerability. More specifically, near-term support to firms has come from an increase in borrowing from banks and net issuance of debt securities. Furthermore, euro area corporates should be able to continue to service their debt, provided that the cost of credit remains low and economic activity and cash flows eventually recover. In addition, a larger share of long-term debt in total corporate debt reduces rollover risk, other things being equal. However, an abrupt end to support measures could lead to an increase in financing and rollover risks, thus driving overall corporate vulnerabilities above the level observed at the height of the global financial crisis.
Chart B
While corporate vulnerabilities have risen sharply during the pandemic amid marked cross-country variation, strong policy support has prevented a rise in insolvencies

Sources: Eurostat, ECB, IHS Markit and ECB calculations.
Notes: Left panel: the number of corporate insolvencies is presented in z-scores, i.e. it is shown in standard deviations from its long-term average, and covers data until the first quarter of 2020 for seven major euro area countries. For illustrative purposes, the composite corporate vulnerability indicator has been rescaled by a factor of three. Right panel: z-scores are calculated based on the pooled sample of all four countries. Q3 2009 and Q1 2013 correspond to the peaks of the euro area composite corporate vulnerability indicator during the global financial crisis and the euro area sovereign debt crisis.
Furthermore, policy support has helped keep actual insolvencies in check so far. Government loan guarantees and bankruptcy moratoria have prevented a large-scale wave of NFC defaults, but a sizeable number of firms could be forced to file for bankruptcy if these measures are lifted too early or bank lending conditions tighten. In fact, the historical co-movement of the vulnerability indicator with corporate insolvencies and GDP growth (see Chart B, left panel) suggests that both government policies and low debt financing costs have helped to dampen the impact of the deterioration in NFCs’ health on the actual number of insolvencies, although the effect varies across countries (see Chart B, right panel), sectors and firm size.
This newly developed indicator highlights that corporate sector vulnerabilities have increased to levels last seen during the euro area sovereign debt crisis. Financing risks have not materialised so far thanks to various support measures, but corporate vulnerabilities may rise further to reach levels observed during the global financial crisis. In particular, if the second wave of the pandemic brings the economic recovery to a halt and growth turns out to be weaker than projected, an early exit from support measures could eventually translate into a marked increase in corporate bankruptcies, with financial stability implications for euro area banks as well.


