


Investment funds and search for yield within the sovereign debt market of highly-rated issuers
Published as part of the The international role of the euro, June 2023.
To what extent do investors reallocate their portfolios of safe assets across major currencies in search for higher returns? In previous years, survey evidence suggested that relatively low yields in euro area fixed-income markets might have been a factor in moderating the global appeal of the euro as a reserve and investment currency.[1] The empirical evidence presented in this box indicates that investors tend to reallocate their portfolio of safe assets in response to changes in yields across major currencies.
The analysis focuses on demand for euro area government debt securities by US mutual funds, which are largely representatives of US and global private investors.[2] The US mutual fund industry has grown rapidly in the past 20 years. Total assets managed by the industry rose from little over USD 5 trillion at the turn of the century to more than USD 16 trillion at the end of 2022.[3] US mutual funds therefore play an important role in intermediating savings from the world’s largest economy to the rest of the world. They are also a growing source of finance in the sovereign debt markets of advanced economies.[4]
The empirical analysis makes use of portfolio data for a panel of US-domiciled mutual funds available at quarterly frequency from Refinitiv Lipper from the first quarter of 2011 to the second quarter of 2022. The analysis focuses on the share of highly-rated euro area government debt[5] in portfolios of advanced economy government debt with similar ratings, as one measure of the global appeal of the euro as an investment currency.[6] The countries included in these global portfolios almost exclusively issue debt denominated in domestic currency – the country of issuance and currency denomination therefore largely overlap.[7] The aim is to gauge the importance of incentives of mutual fund managers to invest in debt securities issued in the euro area by highly-rated sovereigns relative to other issuers in the market for safe assets. The sample is restricted to geographically well-diversified funds, thereby excluding funds with a domestic investment mandate to minimise home bias.[8] This reduces the aggregate share of US Treasuries in the portfolio of highly-rated sovereign debt securities in the sample from almost 83% to 45% on average, bringing it closer to its theoretical benchmark, according to an international Capital Asset Price Model (CAPM).[9] Eventually, the panel of observations includes 186 funds that operate internationally, excluding passive and benchmark-linked funds, with assets under management of USD 1.1 trillion in the second quarter of 2022. This captures about a quarter of total financial assets held by all US-based mutual funds investing in the fixed-income market.
As expected, euro-denominated government debt securities issued by highly-rated euro area sovereigns represent a non-negligible share of the portfolios of safe debt securities of globally active US mutual funds, even though it varies significantly over time. That share stands on average at around 15%, ranging from a peak of 30% in 2011 to lows of around 7-8% in several instances (Chart A). Developments in the share of highly-rated euro area government debt securities are poorly correlated with returns on those debt securities relative to those issued in other countries.[10] This might reflect non-pecuniary factors, such as limits to rebalancing imposed by the necessity to target country shares in benchmark indices, or valuation effects from exchange rate and bond price movements.[11] Netting out these effects is important to identify active portfolio rebalancing by fund managers, which gives rise to actual sales or purchases of debt securities. The resulting measure can then be used to estimate the sensitivity of portfolio rebalancing decisions to changes in relative yields.
Chart A
The share of euro-denominated government debt securities issued by highly-rated euro area sovereigns in the portfolio of globally active US mutual funds is imperfectly correlated with excess returns on these debt securities
Share of highly-rated euro-denominated government debt securities in total fund portfolio of safe assets and excess return on highly-rated euro area government debt securities
(left-hand scale: percentage points; right-hand scale: basis points)
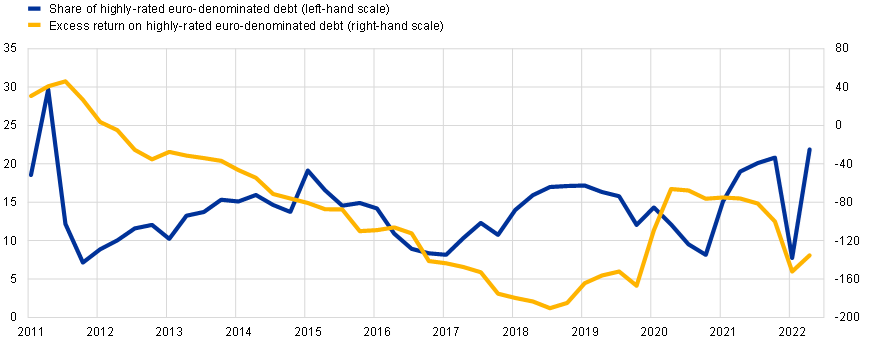
Sources: BIS, Refinitiv Lipper, Refinitiv Eikon and ECB calculations.
Notes: The share of highly-rated euro-denominated debt is computed for the full sample of mutual funds as the aggregate amount of Austria, Belgium, France, Germany and the Netherlands in funds’ portfolios, divided by the aggregate amount of all sovereign debt securities issued by Australia, Austria, Belgium, Canada, France, Germany, Japan, the Netherlands, New Zealand, Switzerland, the United Kingdom and the United States in the portfolios of the funds in the sample. The excess return for the euro area is defined as the average yield (averaged across different maturities up to five years) of debt securities issued by Austria, Belgium, France, Germany and the Netherlands, weighted by debt market capitalisation, minus the weighted (by portfolio shares) average of yields of other countries in the portfolios.
To investigate whether search for yield influences active portfolio rebalancing by fund managers, an empirical model is estimated. It consists of regressing the share of euro-denominated government debt securities issued by highly-rated euro area sovereigns on its own lag, excess returns, and valuation effects caused by changes in bond prices and exchange rate movements against the US dollar, the reference currency of the portfolio.[12] According to the estimates, an increase by 100 basis points in the yields of highly-rated euro area debt securities relative to yields on debt of other reserve currency issuers leads to an increase in the euro area share of over 1 percentage point on average across funds (Chart B). This amounts to a total reallocation of around USD 300 million in each quarter, corresponding to almost 2 percentage points of total foreign flows into highly-rated euro area government debt securities in the sample, according to balance of payments – a non-negligible effect, bearing in mind that the analysis abstracts from transactions by retail and institutional investors.[13]
The empirical analysis can be extended to the share of other currencies in the funds’ portfolio of government debt securities issued by highly-rated issuers. Chart B shows that the effect of yields on government debt securities on active portfolio rebalancing by fund managers differs across currencies. Higher relative returns on US Treasuries result in rebalancing decisions that are 60% stronger than for euro-denominated government debt. There is also statistically significant evidence of search for yield in government debt denominated in Australian dollars and Canadian dollars. This is in line with evidence from a recent study on the determinants of portfolio rebalancing decisions of official reserve managers – i.e. not mutual funds as in this box – possibly suggesting that they are increasingly following similar investment strategies.[14] Finally, estimated coefficients of the impact of excess returns on the share of government debt securities denominated in Japanese yen, pound sterling and Swiss francs are not statistically significant.
Chart B
Excess returns lead to active reallocations into government debt denominated in US dollars, Australian dollars and euro
Estimated coefficients from panel regression
(regression coefficients)
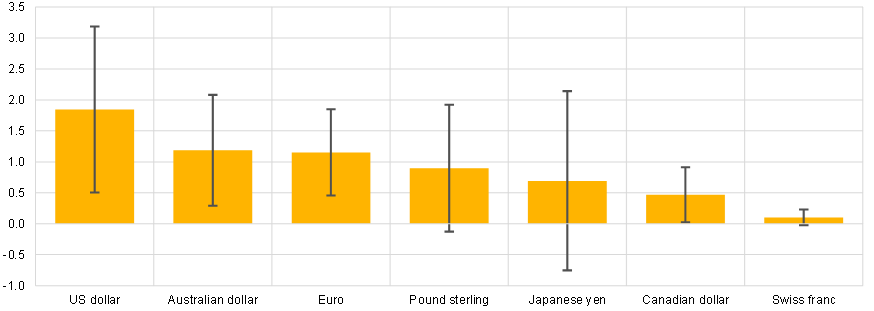
Sources: BIS, Lipper for Investment Management, Refinitiv Lipper Global Data Feed, Refinitiv Eikon and ECB calculations.
Notes: Estimates of the coefficient from the regression estimated separately for Australian dollar, Canadian dollar, euro, Japanese yen, pound sterling, Swiss franc and US dollar. The error bars represent 95% confidence intervals based on Driscoll-Kraay standard errors, which account for heteroskedasticity and cross-section and time series correlation in the error term.
To conclude, US mutual funds have non-negligible exposures to euro-denominated government debt securities issued by euro area sovereigns that are highly-rated, which underscores their importance as safe asset vehicles for US and global investors. Exposures change substantially over time as fund managers actively rebalance their holdings in response to changes in relative yields in their portfolios. This suggests that yield differentials have an influence on the global appeal of the euro as an investment currency.[15]
See Section 2.1 of The international role of the euro, European Central Bank, June 2021.
The literature attributes an important role to currency and country excess returns in explaining changes in mutual funds’ portfolio shares. See, for example, Raddatz, C. and Schmukler, S. (2012), “On the international transmission of shocks: micro-evidence from mutual fund portfolios”, Journal of International Economics, Volume 88, No 2, pp. 357-374, and Camanho, N., Hau, H. and Rey, H. (2022), “Global portfolio rebalancing and exchange rates”, The Review of Financial Studies, Vol. 35, No 11, pp. 5228-5274.
Source: Financial Accounts of the United States, Table L.122, Federal Reserve Board. The expansion of the US mutual fund industry relative to the US banking sector has also been notable; see Financial Stability Board, Global Monitoring Report on Non-Bank Financial Intermediation 2022.
See Fang, X., Hardy, B. and Lewis K. (2022), “Who holds sovereign debt and why it matters”, NBER Working Paper, No 30087.
Euro area highly-rated government debt is defined as debt issued by euro area countries with a Standard & Poor’s credit rating of AA or above between 2011 and 2022. Countries include Austria, Belgium, France, Germany and the Netherlands.
The other countries in the portfolios are Australia, Canada, Japan, New Zealand, Switzerland, the United Kingdom and the United States.
With only the possible exception of Canada, where the share of foreign currency debt was about 10% of total general government debt in 2021; see Bogdanova, B., Chan, T., Micic, K. and von Peter, G. (2021), “Enhancing the BIS government bond statistics”, BIS Quarterly Review, pp. 15-24, June.
Funds with a domestic investment mandate are identified as those funds that hold a share of a particular currency in excess of 90% of the total portfolio on average over the sample period; see Hau, H. and Rey, H. (2008), “Home bias at the fund level”, American Economic Review, Vol. 98, No 2, pp. 333-338.
In the international version of a capital asset pricing model, a country’s portfolio share should equal the market capitalisation of debt issued by that country relative to the global market capitalisation in equilibrium.
The excess return for the euro area is defined as the average yield of government debt issued by Austria, Belgium, France, Germany and the Netherlands, weighted by their market capitalisation based on outstanding central government debt according to data from the BIS debt securities statistics, minus the weighted average of yields of other countries in the portfolio. Formally, the excess return on euro area highly-rated government debt is defined as: , where is the lagged portfolio share of government debt issued by other sovereigns, indexed by k, excluding euro area countries, and is the relative average government debt yields for the three-month, one-year, two-year and five-year maturities for sovereign k.
See, for example, Bubeck, J., Habib, M. and Manganelli, S. (2018), “The portfolio of euro area fund investors and ECB monetary policy announcements”, Journal of International Money and Finance, Vol. 89, Issue C, pp. 103-126 and Bacchetta, P., Tièche, S. and van Wincoop, E. (2023), “International portfolio choice with frictions: evidence from mutual funds”, Review of Financial Studies.
All the explanatory variables are fund-specific and weighted relative to the shares of other countries in the portfolio of each fund. We include fund and time fixed effects to capture the idiosyncratic component of euro area excess returns, purged from aggregate demand shocks that might bias the coefficient of interest. The estimated model equation is . The variable denotes fund ’s share of euro area highly-rated government debt in quarter ; and denote fund and time fixed effects, respectively; denotes the excess return of highly-rated euro area government debt with respect to the weighted average return of other countries in the advanced economy sovereign debt portfolio; and denote changes in the euro area portfolio share caused by price and exchange rate valuation effects respectively; and denotes the error term. Finally, it is assumed that exchange rates follow a random walk so that expectations regarding their future path equal their current value and do not influence the currency allocation.
Mixed funds, investing in both equity and debt securities, are not covered in this analysis. Their inclusion would further expand the portfolio of debt securities held by US mutual funds.
See Arslanalp, S., Eichengreen, B. and Simpson-Bell, C. (2022), “The Stealth Erosion of Dollar Dominance and the Rise of Nontraditional Reserve Currencies”, Journal of International Economics, Vol. 138, No 103656.
See, for example, Du, W., Im, J. and Schreger J. (2018), “The U.S. Treasury Premium”, Journal of International Economics, Vol. 112, pp. 167-181 and Krishnamurthy, A. and Vissing-Jorgensen, A. (2012), “The Aggregate Demand for Treasury Debt”, Journal of Political Economy, Vol. 120, No 2, pp. 233-267.