Climate change and sovereign risk
Published as part of the Financial Stability Review, May 2023.
Climate change can have a negative effect on sovereign balance sheets directly (when contingent liabilities materialise) and indirectly (when it has an impact on the real economy and the financial system). Part of this risk is embedded in the analyses of the macroeconomic costs of climate change which show that transition and physical risks can significantly reduce GDP growth and fiscal buffers. This special feature highlights the contingent sovereign risks that stem from an untimely or disorderly transition to a net-zero economy and from more frequent and severe natural catastrophes. It also looks at the positive role that governments can play in reducing climate-related financial risks and incentivising adaptation. If the recent trend of ever-lower emissions across the EU is to be sustained, further public sector investment is essential. In this context, the progress made to strengthen green capital markets has fostered government issuance of green and sustainable bonds to finance the transition. While putting significant resources into adaptation projects can increase countries’ resilience to climate change, the economic costs of extreme climate-related events are still set to rise materially in the EU. Only a quarter of disaster losses are currently insured and fiscal support has mitigated related macroeconomic and financial stability risks in the past. Looking ahead, vulnerabilities arising from contingent liabilities may increase in countries with high physical risk and a large insurance protection gap. If these risks rise alongside sovereign debt sustainability concerns, the impact on financial stability could be amplified by feedback loops that see sovereign credit conditions and ratings deteriorate.
Introduction
In advanced economies, climate-related fiscal risks have not been explored as extensively as other climate-related financial stability risks. Much progress has been made in assessing the financial stability impact of climate change in recent years, mainly as it relates to non-financial firms, financial markets and intermediaries.[2] While fiscal risks have been widely explored for emerging markets and developing economies,[3] they remain less well examined for sovereigns in advanced economies.
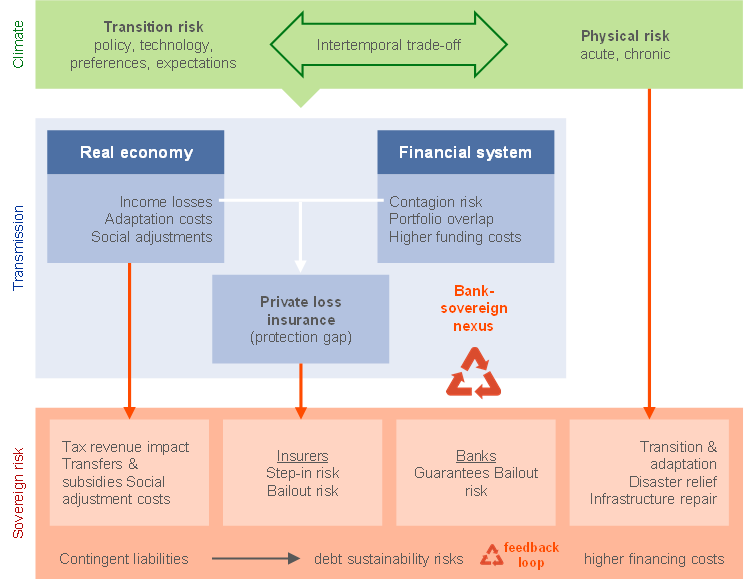
Figure C.1
Sovereign climate-related risks and link to financial stability
Source: ECB.
Although climate change could affect sovereign balance sheets directly, many effects are dependent on the materialisation of physical and transition risks. Physical and transition risks can affect sovereign debt sustainability by impacting the public finances directly, in the form of the substantial investments needed for the transition to net zero and for adaptation as well as the higher fiscal costs incurred following disasters (Figure C.1). In addition, while climate policies such as carbon pricing might increase public revenues, the public finances might be affected indirectly through lower tax revenues as and when risks materialise in the real economy.[4] Higher disaster losses and reconstruction costs for companies imply lower fiscal revenues in areas affected by physical risk. At the same time, governments will face calls for subsidies, social adjustments and compensation packages. Sovereigns may also face contingent liabilities through the financial sector, especially on account of credit losses and explicit or implicit sovereign guarantees, or also through gaps in insurance coverage that governments might be asked to cover. Taken together, these factors can affect a sovereign’s credit quality and debt financing rates.
Governments can help to reduce these risks by fostering the transition to a low-carbon economy and encouraging adaptation.[5] In the past, fiscal support has mitigated some climate-related financial stability risks, especially following large natural disasters. As such risks are expected to intensify, the vulnerabilities arising from contingent liabilities may increase, particularly in countries that are exposed to high levels of transition and physical risk and that have a large insurance protection gap. The following sections analyse how the public sector could reduce climate risk and foster private investment in adaptation measures and in the transition to net zero.
Financing the transition to a net-zero economy
The EU has set targets and designed policies to reduce greenhouse gas emissions by 55% by 2030 and become climate-neutral by 2050. The Fit for 55 package contains a set of policy proposals for achieving this objective. At the same time, the REPowerEU programme complements this with a plan to rapidly reduce dependence on Russian fossil fuels following the Russian invasion of Ukraine. Progress has also been made in strengthening green capital markets, with the European green bond standard designed to foster government issuance of green and sustainable bonds and reduce greenwashing risk. Overall, the EU economy has already reduced emissions by more than 30% compared with 1990 levels, with sectors covered by the EU Emissions Trading System making important contributions, and the share of renewables in the EU energy mix has almost tripled since 1990.[6] However, the road to net-zero emissions is still long. Energy transition scenarios calibrated by the ECB on the basis of pathways defined by the Network for Greening the Financial System (NGFS) point to the need to reduce the share of fossil fuels in the aggregate EU energy mix from 65% in 2022 to 50% by 2030 to achieve the emission reductions outlined above. The share will need to fall to 31% by 2030 to limit the increase in temperature to no more than 1.5°C by the end of the century (Box A).
Box A
The energy transition through the lens of the ECB’s second economy-wide climate stress test
The transition to a carbon-neutral economy is essential to limit the catastrophic impact of climate change and is now a key global priority. The ECB’s first top-down, economy-wide climate stress test demonstrated the importance of a prompt transition.[7] Furthermore, the Russian war in Ukraine has highlighted the additional costs and risks that arise from a high level of dependency on fossil fuels, presenting several challenges but also offering some incentives to speeding up the transition. Building on the premise that the transition is necessary, the ECB’s second top-down, economy-wide climate stress test assessed the impact of three potential transition pathways on the real economy and the financial system over the next eight years.[8]
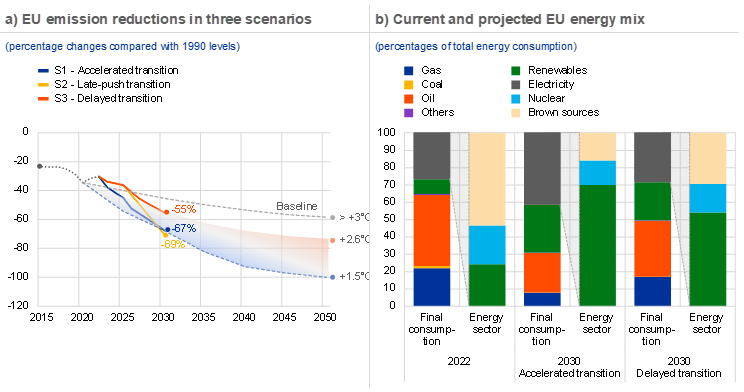
The three transition scenarios differ with regard to the timing and extent of emission reduction by 2030, which lead to different projected temperature increases by the end of the century (Chart A, panel a). The three scenarios imply different levels of long-term transition and physical risk. The accelerated transition scenario assumes an immediate start for the transition which quickly brings the economy onto the optimal Net Zero 2050 pathway defined by the Network for Greening the Financial System (NGFS). In the late-push transition scenario, recent geopolitical and macroeconomic developments lead to a different time profile for the transition, which does not intensify until 2026 but is strong enough to reach a comparable level of emission reduction. The delayed transition scenario assumes similar transition timing but more limited policy action, less investment and hence less emission reduction by 2030.
Chart A
The EU will have to reduce its reliance on carbon-intensive energy sources to meet its climate goals
Sources: European Environment Agency, Eurostat, NGFS and ECB calculations.
Notes: Panel a: Emission pathways refer to the EU aggregate. Temperature increases refer to the year 2100. Emission pathways until 2050 correspond to the NGFS’s Net Zero 2050 (+1.5°C), Nationally Determined Contributions (+2.6°C) and Current Policies (>+3°C) scenarios. Panel b: Brown sources for the energy sector include gas, coal and oil.
A refined modelling framework makes it possible to measure the impact of transition risk on corporates and households by capturing changes in energy dynamics. The main transition efforts in the real economy focus on reducing the use of fossil fuels in favour of renewables and on electrifying production processes. The latter is reinforced by a rapid switch from fossil fuels to renewable inputs in the electricity generation process (Chart A, panel b). The ECB toolbox estimates the impact of transition risk on firms’ energy expenses, green investment, and the revenues of the energy sector as a whole. The main transition risk drivers are energy prices, energy mix and energy consumption, the latter being directly responsible for greenhouse gas emissions. In the short term, firms’ profitability is hit by energy price shocks, causing firms’ operating costs to increase. Higher energy prices and climate change concerns provide an incentive to invest in carbon mitigation activities and renewable energy, thereby increasing firms’ indebtedness.[9] The results feed a credit risk model that estimates transition-shocked probabilities of default (PDs) based on the changes in firms’ profitability and leverage. An additional module assesses the impact of transition risk on households’ solvency.[10]
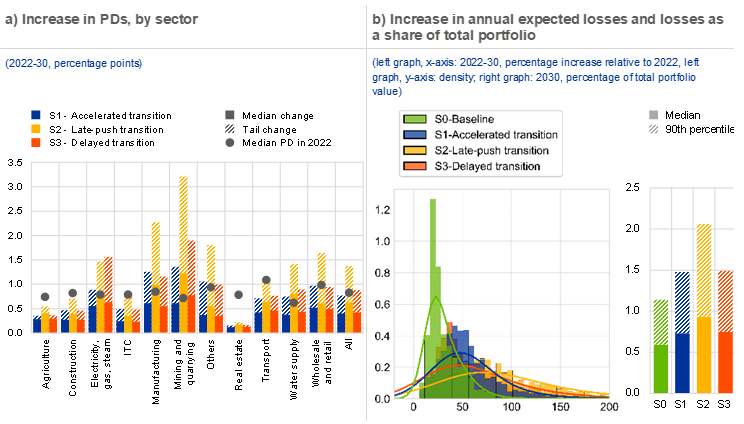
Comparing results across scenarios, the accelerated transition and the delayed transition scenarios lead to similar (and lower) risk levels in 2030; however, the latter entails substantially greater long-term transition and physical risks. Transition impact differs greatly across sectors, with the largest increase in credit risk being experienced if the transition happens late and abruptly (Chart B, panel a). The median corporate PD is slightly below 1% at the starting point and is projected to almost double in the late-push transition scenario in 2030. While corporate PDs increase by around 40 basis points by 2030 in both the accelerated and the delayed transition scenarios, credit risk is expected to increase more strongly in the delayed transition after 2030 due to continuing increases in energy prices and less renewable energy capacity. Moreover, given that emission reductions to 2030 are less ambitious, greater increases in temperatures are expected to lead to more frequent and more severe natural hazards in the long term.[11] Firms in the mining, manufacturing and utility industries are among those with the most severe credit risk impact in the tail of the distribution.
The green transition – be it accelerated or delayed – increases the expected losses and provision needs of banks in the short term but has a limited impact overall relative to portfolio size. Mapping firm-level PDs to information on banks’ individual corporate loans makes it possible to assess the transmission of transition risk from firms to banks. At the same time, the transmission of transition risk from households to banks is assessed using the projected deterioration in the credit quality of the respective portfolio. Annual expected losses for the median bank are 25% higher in 2030 than in 2022 in a baseline scenario without transition risk. This increases by an additional 23% in the accelerated transition scenario, 53% in the late-push transition scenario and 23% in the delayed transition scenario due to transition efforts beyond current climate policies (Chart B, panel b). It follows that banks would be required to increase provisions by at least as much. Annual expected losses relative to portfolio size for the median bank range between 0.6% and 1%, depending on the scenario, and are almost double that level in the tail. The wider distribution of bank-level increases in expected losses indicates greater risks in the late-push transition, where annual expected losses are in excess of 2% of total portfolio value in 2030.
Chart B
Macroeconomic and transition-related developments increase corporates’ PDs and banks’ annual expected losses, but the impact is limited overall relative to loan portfolio size
Sources: Bureau van Dijk – Orbis database, ECB, Eurostat and ECB calculations.
Notes: Panel a: the tail change refers to the 75th percentile of the firm-level distribution for each sector. Panel b: the left graph shows the distribution of bank-level expected losses for a sample of 1,480 euro area banks (instrument coverage: €6.15 trillion of loans to corporates and households), while the right graph refers to a sub-sample of 103 significant institutions (instrument coverage: €5.43 trillion). BL stands for “baseline”.
All in all, an accelerated transition to a carbon-neutral economy would help to contain systemic risk. At the end of the horizon, credit risk is highest in a late-push transition. The accelerated transition and the delayed transition scenarios lead to similar risk levels by 2030, but the latter achieves less ambitious emission reductions. Overall, an accelerated transition does not seem to generate financial stability concerns for the euro area, as long as firms and households can finance their green investments in an orderly manner. However, the heterogeneous results across economic sectors and banks suggest that more careful monitoring of some sub-sets of entities and credit exposures will be required during the transition process.
Governments have proposed transition plans that imply large-scale public and private investment. The European Commission estimates that the additional green investment needed at EU level by 2030 amounts to €520 billion per year (around 3.7% of 2019 GDP).[12] The share of total green investment expected to come from the public sector is between 25% and 45%, but there is a considerable uncertainty around this estimate.[13] A bottom-up analysis, run at firm level and covering around 50% of euro area corporates’ total assets, estimates that the overall amount of green investment required will total around 3% of cumulative GDP over the next eight years in the current macroeconomic environment, and will be mainly targeted at the electricity sector (Chart C.1, panel b). Further public investment in the transition across sectors such as transport, water, housing and telecommunications infrastructure may also have a positive impact on medium-term growth and energy security. At the same time, temporary measures to replace Russian natural gas supplies could jeopardise the green transition in the medium term. More than 100 energy contracts have been signed in the EU since January 2022, mainly for the provision of gas and only half of which involve clean energy.[14] Most of these contracts have long maturities averaging eight years.
Chart C.1
The transition towards net zero implies high levels of investment

Sources: ECB calculations based on Bureau van Dijk – Orbis database, Urgentem, Eurostat, NGFS, the Intergovernmental Panel on Climate Change and IRENA.
Notes: Investments are estimated at firm-level for 2.9 million euro area companies (accounting for 52% of euro area corporates’ total assets as at end-2020) as part of the ECB’s second top-down, economy-wide climate stress test. For the electricity sector, investment in renewable energy capacity is modelled based on experience curves and includes solar and offshore/onshore wind energy. For all other sectors, investments in carbon mitigation activities like carbon sequestration, energy-efficient buildings and machinery, and carbon capture and storage are also considered. The transition scenarios are described in Box A.
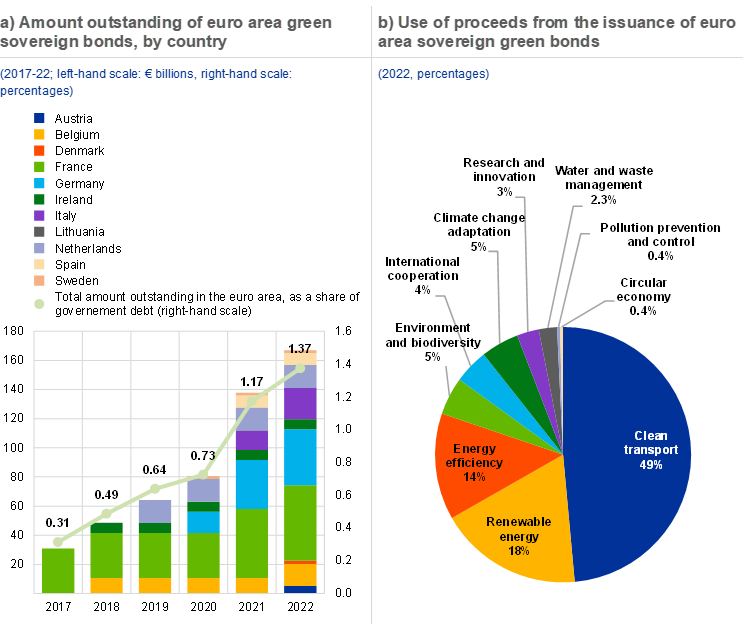
The issuance of sovereign green bonds has picked up in the euro area in recent years. Green sovereign bonds increasingly help to fund government investment in projects with environmental objectives (mostly climate change mitigation). So far, clean transport has been the main beneficiary (almost 50%) of investment from green bond issuance by euro area governments, followed by energy efficiency (including green construction) and renewable energy which together represent a third of allocations (Chart C.2, panel b). Public sector participation also fosters the development of private sector green markets by increasing liquidity and by setting frameworks with best practices that promote standards for green bond classifications and their verification. This also helps to minimise the risk of greenwashing.
Chart C.2
Sovereign green bond markets in the euro area continue to develop, and the proceeds help to support environmental projects
Sources: Bloomberg Finance L.P., debt agencies (allocation reports) and ECB calculations.
Notes: Panel a: the light green line represents the total amount outstanding of green bonds issued by euro area sovereigns as a share of euro area government debt. Bloomberg classifies bonds as green according to the information provided by the debt agencies. Panel b: the latest publicly available allocation reports are used.
The efforts made to strengthen green capital markets in the EU have encouraged euro area sovereigns to enter green bond markets.[15] While the market is expanding rapidly, it still only accounts for less than 1.5% of all euro area government debt (Chart C.2, panel a). Performance-linked bonds with a less restrictive use of proceeds and whose payout depends on verifiable reductions in overall greenhouse gas emissions – such as sustainability-linked bonds[16] – could attract more investors, while also being more conducive to long-term policy commitments.
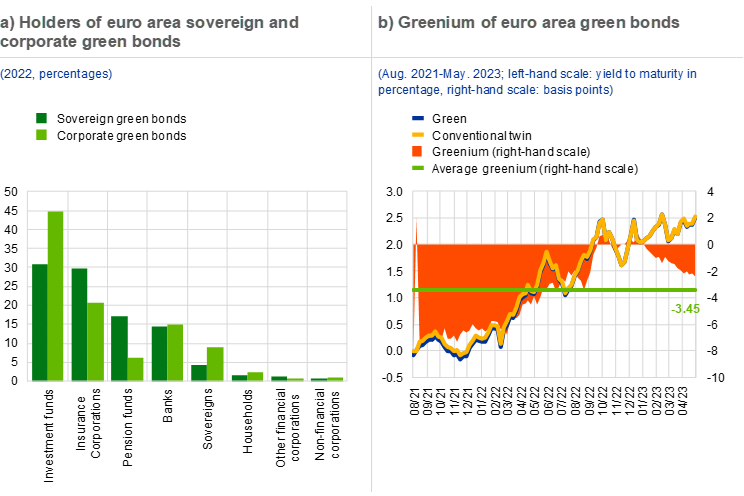
The non-bank financial intermediation sector is the main holder of euro area sovereign green bonds. Financial institutions are by far the main investors (over 90%), with households and non-financial corporations at the other end of the scale. The share of institutional investors with a long-term perspective, such as insurance corporations and pension funds, is almost 50% (Chart C.3, panel a). Many of these investors have incorporated ESG considerations into their mandates and asset allocation strategies, but are probably also attracted by the normally longer maturity of sovereign green bonds (given the longer horizon of green projects) that matches their buy-and-hold strategies. At the same time, participation rates for investment funds are substantially lower than in the corporate green bond market.
Chart C.3
Sovereign green bonds are attractive for long-term institutional investors amid a vanishing greenium
Sources: Bloomberg Finance L.P., ECB and ECB calculations.
Notes: Panel b: amount outstanding weighted average greenium. The greenium refers to the difference in yield to maturity between green bonds and conventional bonds. Different methods are used in the literature to estimate this discount – for this analysis it has been estimated by matching, when possible, each green bond with a conventional sovereign bond based on similar features such as rating and maturity (the “conventional twin”).
Early issuances of euro area sovereign green bonds benefited from the existence of a greenium.[17] Similar to the green corporate bond segment[18], euro area sovereigns have until recently been able to finance green projects using green bonds at a cheaper rate (averaging -3.5 basis points lower) than if they had issued an equivalent regular bond (with similar maturity and the same credit risk) (Chart C.3, panel b).[19] The imbalance between supply and demand in the green bond market is the most likely factor behind the existence of a greenium. In recent months, this greenium has shrunk, which might reflect a better supply-demand balance but could also point towards worsening liquidity conditions in euro area sovereign bond markets (Chapter 2 and Special Feature A). While the disappearance of the greenium implies higher returns for investors, it also means that it has become more expensive for sovereigns to finance green projects.
Contingent liabilities and risk-reduction and adaptation policies
Governments can themselves face the risk of having to step in to cover some of the costs of climate risk. Public investments aimed at fostering the green transition may be characterised by a fiscal multiplier which is able to enhance economic growth while having a positive effect on the public finances. At the same time, higher costs following disasters, as well as greater investment (or the lack thereof) in adaptation and risk mitigation, can have direct fiscal implications.[20] In particular, climate risks could have a gradual, negative impact on the conditions surrounding public finance as a result of lower tax revenues, higher public debt and the reallocation of funds from other investments. They could also trigger explicit and implicit contingent liabilities – which are potential costs that materialise if catastrophes occur – that may exceed previously allocated funds and thus suddenly hit public finances. Although the exact fiscal implications are difficult to predict, they could clearly weigh on debt sustainability and borrowing costs.
Contingent liabilities may be a significant source of risk for sovereigns, should the net-zero transition be untimely or disorderly.[21] Historical evidence shows that the largest fiscal costs relate to financial sector claims and public bailouts of state-owned enterprises stemming from implicit commitments. This is especially the case in sectors of the economy that are relevant for the transition, such as utilities, transport and manufacturing. In addition, sovereign contingent liabilities tend to materialise in waves and can be exacerbated by drops in GDP growth.
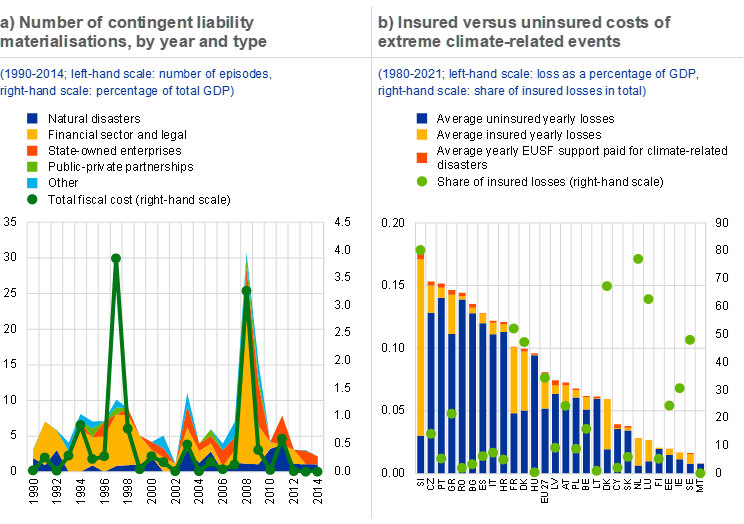
As climate change advances, the explicit and implicit contingent liabilities from physical risk could increase as well. Historically, the fiscal costs of natural disasters have been less severe than financial sector claims (Chart C.4, panel a), but the frequency and severity of extreme weather events is on the rise.[22] Explicit costs, such as damage to infrastructure and property, and implicit liabilities, such as guarantees for private investments and the financial sector, can become increasingly significant. In addition, this fiscal pressure may come in periods of lower growth and tax revenues, as capital is typically absorbed by reconstruction activities. A recent analysis by the European Commission, which simulates the fiscal shocks of natural disasters in 13 EU countries, projects debt-to-GDP ratios to be on average 2.3 and 2.7 percentage points higher by 2032 in 1.5°C and 2°C global warming scenarios respectively.[23] This highlights the need for fiscal authorities to reflect contingent liabilities related to physical risk in their debt sustainability analysis.[24]
Chart C.4
As climate change advances, contingent liability risks are more likely to materialise if the share of insured disaster losses remains low
Sources: Panel a: Bova et al.*; panel b: CATDAT, Eurostat, EUSF data and ECB calculations.
Notes: Contingent liabilities are defined as obligations that only materialise when a certain event occurs. Panel a: data are for 34 advanced economies and 46 emerging markets and developing economies. Panel b: only data for EU countries are included. The figures on insurance are based on CATDAT and do not account for public-private partnerships or other factors affecting the share of insured losses. The yearly insured and uninsured losses are calculated as averages over the aggregate estimates of losses between 1980 and 2021 inclusive, while the EU Solidarity Fund (EUSF) support paid for climate-related disasters is an average between 2002 and 2021. GDP is as of 2021. There have been no applications by Denmark or Finland for financial support under the EUSF.
*) Bova, E., Ruiz-Arranza, M., Toscani, F. and Ture, H., “The Impact of Contingent Liability Realizations on Public Finances”, International Tax and Public Finance, Vol. 26, Issue 2, 2019, pp. 381-417.
In this context, insurance can mitigate the fiscal costs associated with disasters, yet only 25% of disaster losses are insured (Chart C.4, panel b). Fiscal support measures have mitigated macroeconomic and financial stability risks related to natural disasters in the past, as governments have typically funded some of the recovery and reconstruction activities.[25] But expectations of such unconditional government support can create moral hazard and lower the incentives for households and firms to adapt and reduce their vulnerability to climate-related catastrophe risks. A large insurance protection gap can therefore increase the vulnerabilities arising from contingent liabilities in countries with high physical risk, amplifying the direct impact of disasters on debt sustainability and potentially having a negative effect on sovereign creditworthiness.[26] Climate-related events are also likely to have varying effects on the fiscal stability of European countries, as economies differ significantly in their climate risk exposures, vulnerabilities and resilience.
This emphasises the need for enhanced catastrophe risk management tools and risk-sharing mechanisms that can complement private insurance and increase resilience, at both national and EU level. As climate-related risks are unlikely to be sufficiently insured by the private sector, targeted fiscal buffers, natural disaster funds, catastrophe bonds and investments in risk reduction and adaptation can help tackle uninsured losses from disasters. In addition, fostering stronger cooperation with the private (re)insurance sector through public-private partnerships could direct a greater share of financial assets towards climate resilience. Finally, an EU-wide scheme for catastrophe insurance could help further reduce the losses from less frequent and large-scale disasters by exploiting the risk-pooling benefits across EU countries, while incentivising and promoting adaptation.[27]
As climate risks can materially affect public finances, credit ratings globally seem to reflect some climate-related variables at country level, especially after the Paris Agreement.[28] Higher temperature anomalies and more frequent natural disasters are associated with lower ratings for advanced, emerging and developing economies. Countries that are more resilient to extreme weather events consistently tend to have higher ratings. But transition risk factors, such as carbon emissions and energy consumption, do not appear to be reflected in ratings. And even when statistically significant, climate variables play a marginal role in influencing credit ratings.
For financial stability, it is important for rating agencies to incorporate all relevant climate-related variables into their credit risk assessments. This would reduce the risk of abrupt repricing and allow investors, financial institutions such as banks and insurers, and central banks to reflect sovereign climate-related risks adequately and consistently in the risk weights used for prudential and risk management purposes. In addition, following its strategy review, the ECB is exploring the extent to which climate considerations are included in credit ratings.[29]
Conclusions and policy implications
Climate change can be a significant source of risk for sovereigns through contingent liabilities and through its impact on the real economy and the financial system. Beyond the sizeable investments associated with the transition to net zero and the costs of adaptation, higher disaster losses and reconstruction costs imply lower tax revenues from companies in areas affected by physical risk, while governments will face calls for subsidies, social adjustments and compensation. In addition, if climate-related financial risks rise together with sovereign debt sustainability concerns, the impact may be amplified by feedback loops that see credit conditions and ratings deteriorate.
The public sector can adopt policies and investments to increase countries’ resilience to these risks and incentivise risk reduction and adaptation. The available evidence suggests that green investments should increase further if the EU emissions-reduction target is to be met by 2030. The ECB’s recent economy-wide stress test shows that the corporate sector needs an overall amount of green investment totalling around 3% of cumulative GDP over the next eight years. The progress made to strengthen green capital markets, such as the European green bond standard, has fostered government issuance of green and sustainable bonds by reducing greenwashing risk to some extent and reinforcing flows of funding that support the transition. Governments also face the risk of having to step in to cover the costs of climate-related catastrophes materialising. In this context, a recent ECB-EIOPA Discussion Paper sets out possible actions to tackle the insurance protection gap and mitigate catastrophe risks from climate change in the EU. These include enhanced disaster risk management tools for the public sector and risk-sharing mechanisms that can enhance resilience at both national and EU level, such as public-private partnerships and an EU scheme for natural disaster insurance.[30]
This special feature has benefited from input from Tina Emambakhsh, Riccardo Pizzeghello and Elisa Telesca.
Much of the evidence to date on euro area financial stability relates to transition and physical risks to non-financial firms and risks to the financial system, sustainable financial markets and the development of related policies. See the box entitled “Carbon-related concentration risk: measurement and applications”, Financial Stability Review, ECB, November 2022, the special feature entitled “Climate-related risks to financial stability”, Financial Stability Review, ECB, May 2022, and the special feature entitled “Climate-related risks to financial stability”, Financial Stability Review, ECB, May 2021. IMF staff have also recently outlined the emerging approach to assessing the impact of climate change in the context of the IMF’s Financial Sector Assessment Program (FSAP). See “Approaches to Climate Risk Analysis in FSAPs”, Staff Climate Notes, July 2022.
See, for instance, “Scaling up Climate Finance in Emerging Markets and Developing Economies: Challenges and Opportunities”, Chapter 2, Global Financial Stability Report, International Monetary Fund, October 2022.
For an overview of EU fiscal policies and instruments related to climate change, see Avgousti, A. et al., “The climate change challenge and fiscal instruments and policies in the EU”, Occasional Paper Series, No 315, ECB, 2023.
A joint, coordinated transition effort involving governments around the world is essential if physical risks and their medium/long-term impact are to be reduced.
According to data from the European Environment Agency and Eurostat.
See Alogoskoufis, S. et al., “ECB economy-wide climate stress test – Methodology and results”, Occasional Paper Series, No 281, ECB, September 2021.
The three transition scenarios have been calibrated by combining climate scenarios developed by the Network of Central Banks and Supervisors for Greening the Financial System with December 2022 Eurosystem staff macroeconomic projections and incorporating the latest data on the energy mix. The eight-year horizon is selected because the green transition is expected to take place in the short to medium term and 2030 represents the cut-off date for several climate policy targets.
Investment needs are estimated at firm level and are assumed to be proportional to projected emission reductions. This results in aggregate green investments of between €2.5 and €3.2 trillion over the next eight years, depending on scenario, for 2.9 million firms that account for 50% of total corporate assets in the euro area. See Chart C.1 for further details.
Households’ financial resilience is assessed based on bank-to-country-level information on mortgages combined with country-level information on households’ energy consumption, emissions and investments, as well as financial and macroeconomic variables. The deterioration in the credit quality of households’ portfolios is measured by the share of newly defaulted loans over time.
The considerations regarding long-term physical risk hold under the assumption that all global economies will reduce their emissions as described in the respective NGFS scenario and therefore in a way which is compatible with global temperatures increasing by no more than 1.5°C (in the first two scenarios) or 2.6° (in the third scenario) by 2100.
See “Towards a green, digital and resilient economy: our European Growth Model”, European Commission, March 2022. The more recent REPowerEU plan requires around €210 billion of investment between now and 2027 to phase out Russian fossil fuel imports, only part of which is included in these estimates.
See “Building a smart and green Europe in the COVID-19 era”, Investment Report 2020/2021, European Investment Bank, January 2021, and the article “Fiscal policies to mitigate climate change in the euro area”, Economic Bulletin, Issue 6, ECB, 2022. Green investments from the public sector can take the form of direct investments or subsidies.
See EU Energy Deals Tracker, European Council on Foreign Relations, November 2022.
See “Towards a green capital markets union for Europe”, speech by Christine Lagarde at the European Commission’s high-level conference on the proposal for a Corporate Sustainability Reporting Directive, 6 May 2021, and “New challenges in a changing world”, speech by Christine Lagarde at the Deutsche Börse Annual Reception in Eschborn, 23 January 2023.
See “Sovereigns and sustainable bonds: challenges and new options”, BIS Quarterly Review, Bank for International Settlements, September 2022.
When a green bond has a lower yield than a similar conventional bond without the green label, the green bond is said to exhibit a greenium. A greenium implies that the price of the green bond is higher than that of a similar, conventional bond.
See Pietsch, A. and Salakhova, D., “Pricing of green bonds: drivers and dynamics of the greenium”, Working Paper Series, No 2728, ECB, 2022.
See Ando, S., Fu, C., Roch, F. and Wiriadinata, U., “How Large is the Sovereign Greenium?”, IMF Working Papers, No 23/80, International Monetary Fund, 2023.
See Dunz, N. and Power, S., “Climate-Related Risks for Ministries of Finance: An Overview”, technical report, The Coalition of Finance Ministers for Climate Action, 2021; Cebotari, A., “Contingent Liabilities: Issues and Practice”, IMF Working Papers, No 8, International Monetary Fund, 2008; “NGFS Climate scenarios for central banks and supervisors”, NGFS Publications, Network for Greening the Financial System, June 2020; Schuler, P., Oliveira, L.E., Mele, G. and Antonio, M., “Managing the Fiscal Risks Associated with Natural Disasters”, Fiscal Policies for Development and Climate Action, World Bank Group, 2018; Volz, U. et al., “Climate change and sovereign risk”, SOAS, University of London, 2020; and Zenios, S.A., “The risks from climate change to sovereign debt”, Climatic Change, Vol. 172, No 30, June 2022, pp. 1-19.
See the box entitled “Contingent liabilities: past materialisations and present risks”, Financial Stability Review, ECB, May 2021.
See Bova, E. et al., “The impact of contingent liability realizations on public finances”, International Tax and Public Finance, Vol. 26, Issue 2, 2019, pp. 381-417.
See “Fiscal Sustainability Report 2021”, European Economy Institutional Papers, No 171, European Commission, April 2022, and the box entitled “Including climate change risks in the DSA: concepts and definition”, Debt Sustainability Monitor 2019, European Commission, January 2020.
See also “OECD Recommendation on Disaster Risk Financing Strategies”, OECD, February 2017, and “Enhancing Financial Protection Against Catastrophe Risks: The Role of Catastrophe Risk Insurance Programmes”, OECD, October 2021.
A recent costly event in Europe occurred in 2021 when summer floods hit several western European countries, causing overall damage of €46 billion, of which only €11 billion was insured. As a result, Germany committed up to €30 billion to fund its reconstruction efforts.
See Fache Rousová, L. et al., “Climate change, catastrophes and the macroeconomic benefits of insurance”, European Insurance and Occupational Pensions Authority, July 2021, and “The macroprudential challenge of climate change”, ECB/ESRB Project Team on climate risk monitoring, European Systemic Risk Board, July 2022.
See “Policy options to reduce the climate insurance protection gap”, Discussion Paper, ECB/EIOPA, April 2023.
This evidence is based on a panel regression including 124 countries over the period from 1999 to 2021. The dependent variable is the average of sovereign ratings issued by S&P, Moody’s, Fitch and DBRS. Physical risk variables include country-level temperature anomalies and the frequency of natural disasters. Transition risk variables include carbon emissions, primary energy consumption per unit of GDP, and a forward-looking measure calculated as the percentage difference in carbon emissions under the business-as-usual and the target-achievement scenarios. As a robustness test, two Notre Dame-Global Adaptation Index (ND-GAIN) indicators of a country’s readiness and vulnerability to physical risk are used to proxy the resilience of a country in the face of extreme weather events and its predisposition to be impacted by these climatic events respectively.
See Breitenstein, M., Ciummo, S. and Walch, F., “Disclosure of climate change risk in credit ratings”, Occasional Paper Series, No 303, ECB, September 2022.
See “Policy options to reduce the climate insurance protection gap”, Discussion Paper, ECB/EIOPA, April 2023.


