


Geopolitical fragmentation risks and international currencies
Geopolitical fragmentation risks and international currencies
Published as part of the The international role of the euro, June 2023.
Shortly after Russia invaded Ukraine, several packages of unprecedented sanctions were imposed on Russia, including the freezing of nearly half of the Russian central bank’s foreign exchange reserves and the exclusion of a number of Russian banks from SWIFT, the dominant financial messaging system used to facilitate cross-border payments. Several observers noted that these sanctions may have far-reaching consequences for the role of the currencies of the sanctioning countries – including the US dollar and the euro – in the international monetary and financial system. According to these observers, countries that are not fully aligned geopolitically with the United States might reduce their exposures to the currencies of sanctioning countries going forward. However, other observers have been more cautious and pointed to challenges involved in diversifying from the major international currencies. This special feature sheds light on this debate by reviewing the available evidence on the effects of geopolitical fragmentation risks on the use of international currencies. It shows that evidence of potential fragmentation in the international monetary system since Russia’s invasion has so far been mainly restricted to announcements and specific cases rather than pointing to broader trends. Anecdotal evidence, including official statements, points to intentions of some countries to develop the use of alternatives to major traditional currencies, such as the Chinese renminbi, the Russian rouble or the Indian rupee for invoicing international trade. There is also evidence that Russia has been using the Chinese renminbi to a significantly greater extent for international invoicing and cross-border payments in the past few months. However, the available data do not show substantial changes in the use of international currencies as yet. One exception is evidence of increased accumulation of gold as an alternative reserve asset, possibly driven by countries geopolitically closer to China and Russia.
1 Overview of the debate on the impact of geopolitical fragmentation risks on the international monetary system
Russia’s invasion of Ukraine might represent a watershed for the future of globalisation and the international monetary system. Several observers have argued that Russia’s invasion has opened a new chapter for the global economy and geopolitics, contributing inter alia to geo-economic fragmentation – a reduction in the degree of economic and multilateral integration and cooperation.[1] Supply chain networks could be re-oriented towards geopolitical allies (a process known as friendshoring), affecting patterns of global trade and finance.[2] Whether these developments might have consequences for the international monetary system, which is centred on the US dollar, is the subject of intense debate.
Some observers have argued that sanctions imposed on Russia might have eroded confidence among countries that are not geopolitically aligned with the United States in the safety of dollar reserves and payment rails. Following the freezing of nearly half of the Russian central bank’s reserves, some countries might reduce the insurance value they assign to foreign exchange reserves if they fear facing sanctions in the future.[3] Financial sanctions applied to foreign-owned US dollar assets – it has been argued – reduce their usability and thereby liquidity.[4] Some countries might then be incentivised to diversify their reserves into non-traditional currencies, physical gold, or reduce their level of exposure to foreign exchange reserves. Countries with strong trade relationships could be inclined to collaborate and form fragmented currency blocs.[5]
Anecdotal evidence, including official statements, points to the intention of some countries to develop the use of alternatives to the currencies of countries that applied sanctions. The past year has seen several announcements of new trade agreements to develop the use of local currencies for trade invoicing, notably of commodities, and the potential creation of new common currencies, as an alternative to the US dollar, the euro and other currencies of countries applying the sanctions (Table A.1). Increasing use of non-traditional currencies in trade invoicing would in turn create incentives to hold larger shares of foreign exchange reserves in non-traditional currencies in a positive feedback loop.[6] This could fragment the international monetary system along geopolitical lines.[7]
The implications of a more fragmented international monetary system would be potentially significant. For instance, recent research suggests that a 1% reduction in China’s US dollar reserves could translate into an increase of five-year and ten-year yields of up to 25 basis points in the short run.[8] Furthermore, lower demand for foreign exchange reserves could contribute to increasing exchange rate volatility.[9]
Table A.1
Anecdotal evidence on the intentions of some countries to use alternative units to the major international currencies
Overview of selected news and statements
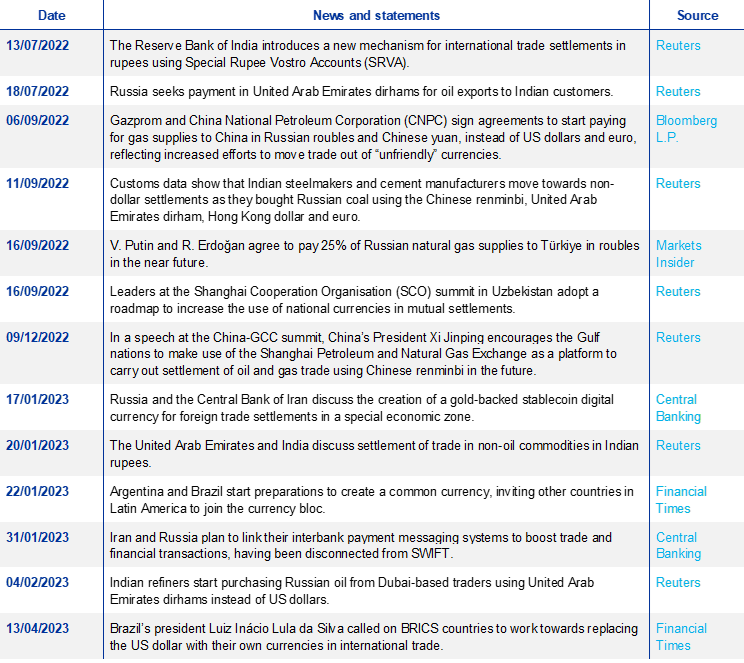
Sources: Reuters, Bloomberg L.P., Markets Insider, Central Banking and the Financial Times.
By contrast, several economic arguments support, a priori, the resilience of the global role of the US dollar to geopolitical shocks.[10] First, sound institutions and macroeconomic fundamentals – to which the United States and other major reserve currency issuers are committed – are essential determinants of the currencies used as a global safe asset. Second, there is no obvious alternative to deep and liquid financial markets in debt securities in US dollars, which are open to both domestic and foreign investors. The international role of the Chinese renminbi has progressed but remains limited. Limited capital account convertibility and limited exchange rate flexibility hinder the development of the renminbi’s role which, to develop through trade, investment and policy support, requires continued dollar backing (Box 1). Gold provides safety but is not remunerated and is supplied inelastically; it also needs to be stored domestically at a cost or face risks of remaining within the reach of sanctions.[11] Crypto-assets, either unbacked or presumably backed, such as stablecoins, remain too volatile and opaque to qualify as reserve currency assets as the repeated crashes in crypto-asset markets illustrate.[12]
Geopolitical considerations could also favour the status quo. Recent research suggests that approximately 50% to 60% of foreign-held US short-term assets are in the hands of governments with strong geopolitical relations with the United States and are thus unlikely to be divested for geopolitical reasons.[13] Signalling effects are other factors: by accumulating foreign assets in sanctionable currencies such as the US dollar and the euro, countries signal their commitment to international law and good governance principles, which cement their credibility with foreign investors. Through this channel, imposing sanctions on a country that breaks international law could in fact enhance the role of currencies of major economies that are compliant with the sanctions.[14]
2 Preliminary evidence on geopolitical fragmentation risks for official reserve holdings
There is no significant evidence that geopolitical fragmentation risks have led to a reduction in the level of demand for major reserve currencies. Admittedly, the stock of global foreign exchange reserves declined in 2022, but this was largely driven by valuation effects and foreign exchange interventions – and not the result of more limited appetite for foreign exchange reserves denominated in the major currencies. Total allocated foreign exchange reserves increased from approximately USD 1.4 trillion in 1999 to USD 12.0 trillion in 2021, before declining by almost USD 1 trillion in 2022. Valuation effects accounted for a large portion of this decline as bond prices fell and the major reserve currencies depreciated against the US dollar (Box 3). Furthermore, exchange rate interventions by central banks of a number of countries, such as Japan, Hong Kong, India and Singapore, resulted in large sales of US dollars in exchange for domestic currency amid broad dollar strength in 2022.
In terms of composition of foreign exchange reserves, diversification into non-traditional currencies continued in 2022, but at a slower pace compared with previous years. Since the global financial crisis of 2007-09, reserve diversification into non-traditional reserve currencies, i.e. the Chinese renminbi and currencies that are not part of the IMF’s Special Drawing Rights (SDR) basket has intensified.[15] This shift reflects active portfolio diversification decisions by central bank reserve managers in both emerging and advanced economy countries who, in a search for higher returns, leverage on the growing liquidity of non-standard currencies.[16] However, this trend has not accelerated visibly since Russia invaded Ukraine. The share of non-SDR currencies increased in 2022 by 0.5 percentage points, a slower pace than in previous years (Chart A.1). The share of the Chinese renminbi in global foreign exchange reserves remained stable.[17]
Chart A.1
Diversification into non-traditional reserve currencies has not accelerated visibly since Russia’s invasion of Ukraine
Evolution of the share of the main reserve currencies and non-traditional reserve currencies in total allocated foreign exchange reserves
(percentages, at current exchange rates)
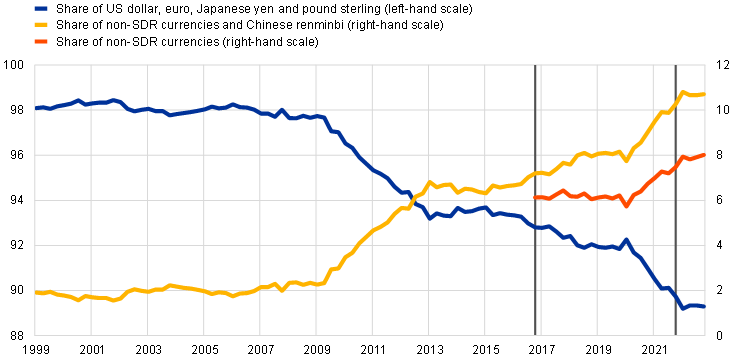
Sources: IMF and ECB calculations.
Notes: The main reserve currencies are the US dollar, the euro, the Japanese yen and the pound sterling. Although COFER provides separate data on reserves held in the Australian dollar, Canadian dollar, Chinese renminbi and the Swiss franc, Arslanalp et al. (2022) estimate that the remaining reserve currencies are the Swedish krona, Norwegian krone, Danish krone, Korean won, Singapore dollar, New Zealand dollar and the Hong Kong dollar. The share of non-SDR currencies comprises all currencies other than the main four currencies mentioned above together with the Chinese renminbi, as the latter was added to the SDR basket in 2016. The first vertical line from the left-hand side marks the introduction of the Chinese renminbi to the SDR basket, while the second vertical line indicates the beginning of 2022.
The role of gold as a reserve asset has increased in the last decade. Amounts of gold held as official reserve assets have increased steadily since the global financial crisis. Moreover, the share of gold in total reserves has risen in the past decade to reach almost 13% of total reserves in 2022, close to its 1999 peak (Chart A.2, panel a). Accumulation was mainly driven by emerging market economies, possibly as a result of low yields on major reserve currencies and, therefore, lower opportunity costs of holding unremunerated assets such as gold.[18]
Gold accumulation by central banks increased noticeably in the wake of Russia’s invasion of Ukraine. According to estimates by the World Gold Council (WGC), 2022 saw the highest purchases of gold by central banks on record (Chart A.2, panel b). The official numbers reported to the IMF, however, paint a different picture. They indicate that the share of gold in global official reserves increased by a modest 0.9 percentage points in 2022 and that gold held as reserve assets decreased in volume. The difference can be explained by large amounts of “unreported purchases” by central banks estimated by the WGC – which are not reported in official IMF figures.[19] Among the reporting countries, gold purchases were mainly from central banks in emerging markets. Türkiye was the largest purchaser (with 148 tonnes), bringing its gold reserves to a record level. The People’s Bank of China reported an increase in its gold reserves for the first time in three years and bought a total of 62 tonnes in the last two months of 2022. Other central banks that increased their gold holdings significantly included India, Egypt, Qatar, Iraq, the United Arab Emirates and Oman.
Chart A.2
Central bank demand for gold hit a record high in 2022 according to some estimates
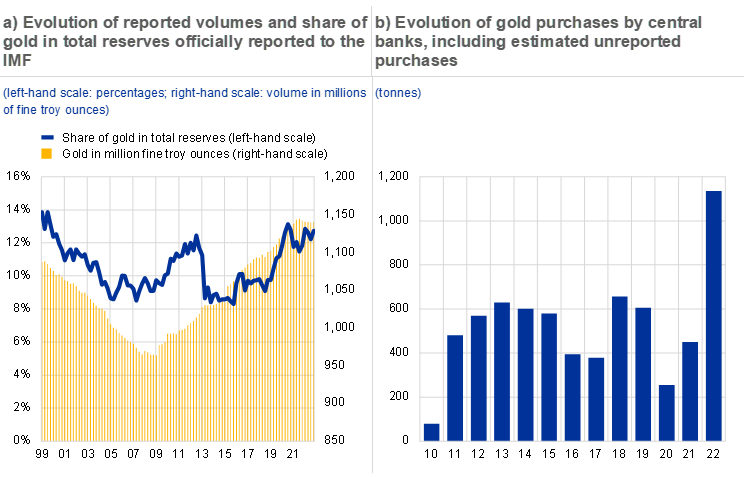
Sources: IMF International Financial Statistics, Metals Focus, Refinitiv GFMS and World Gold Council.
Notes: Panel a shows the volume of gold in fine troy ounces and the share of gold in total reserve assets officially reported to the IMF. The share is calculated using gold at market prices and total reserve assets in US dollars, using current exchange rates. Panel b shows the demand for gold by central banks and other institutions reported by the World Gold Council, including estimates of unreported purchases.
3 Estimating the role of geopolitical factors in explaining developments
Whether the recent geopolitical factors explain developments in official reserve portfolios remains an open question that needs to be addressed. One way to identify the effect is to examine to what extent cross-country developments depend on geopolitical alliances using an index of geopolitical alignment with China-Russia versus the United States developed by ECB staff (Box A).
Box A
An index of geopolitical alignment
This box details the construction of a new index of geopolitical alignment, which is used to gauge whether geopolitics might be one of the factors explaining recent developments in the composition of official reserve holdings. The index provides a summary assessment of the closeness of a country to two spheres of geopolitical influence, one being the United States and the other Russia and China.
Chart A
Patterns of geopolitical alignments vary between advanced economies and emerging market economies
Distribution of the geopolitical index for advanced economies and emerging market and developing economies
(x-axis: geopolitical index)
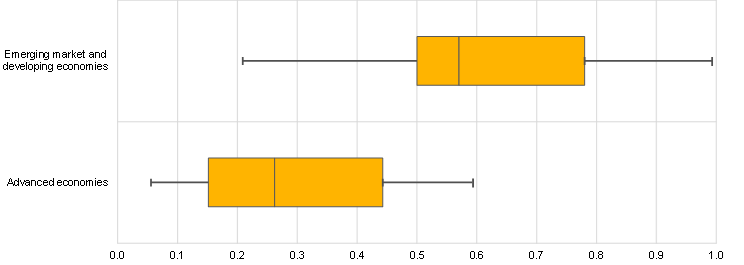
Sources: ECB calculations based on the Global Sanctions Database (GSDB), SIPRI Arms Transfers Database, Green Finance & Development Center and the United Nations.
Notes: The boxplots show the distribution of the geopolitical index, including the minimum and maximum values and the 25th, 50th and 75th percentiles for each group of countries. A higher value of the index indicates that a country is geopolitically closer to China and Russia than to the United States.
The geopolitical index is based on four different proxies of political alignment between countries, measured for the past decade. The first variable is the number of times a country has been sanctioned by China and Russia minus the number of times it has been sanctioned by the United States, using data from the Global Sanctions Database.[20] This database was used in related scholarly research linking historical patterns in the evolution of the share of gold in foreign exchange reserves and sanctions.[21] The second variable is the share of military imports from Russia and China minus the share of imports from the United States, obtained from the SIPRI Arms Transfers Database on bilateral military imports. The third variable indicates whether a country participates in the Belt and Road Initiative (BRI) – a Chinese-led project which was launched in 2013 with the initial aim of expanding trade links between Asia, Africa and Europe, but is increasingly seen as a tool for projecting China’s influence globally.[22] The fourth variable is country voting on the resolution of the Eleventh Emergency Special Session of the United Nations General Assembly adopted on 2 March 2022 on Russia’s invasion of Ukraine, in the spirit of other studies that used data on UN votes as a proxy for political alignment.[23] Each variable is scaled and normalised to vary from zero to one, and averaged out to create an index for which increasing values indicate closer geopolitical alignment with China and Russia compared with the United States.
Chart A reports the distribution of countries according to the index, split between advanced economies and emerging or developing economies. Advanced economies tend to be more closely aligned with the United States compared with China and Russia, unlike emerging and developing economies. However, the geopolitical alignment of the latter economies is more dispersed than that of advanced economies.
There is no evidence that diversification of official reserves into non-SDR currencies in the review period was directly related to geopolitical considerations. Chart A.3, panel a plots the changes in the share of non-SDR currencies in total foreign exchange reserves and the geopolitical index for a restricted set of countries that actively diversified into non-SDR units in 2022.[24] The lack of correlation between the two variables is apparent from the chart. This suggests that the accumulation of non-SDR currencies does not seem to be directly related to geopolitical factors.
By contrast, there are signs that geopolitical considerations were a motive behind diversification into gold in 2022 in some cases. Chart A.3, panel b plots changes in the share of gold in total reserve assets in 2022 against the geopolitical index for a restricted set of countries that diversified actively into gold in that year.[25] It is possible to identify a positive correlation between these two variables.[26] In other words, the closer countries are geopolitically to China and Russia compared with the United States, the more they increased the share of gold in their official foreign reserves – a pattern that was particularly apparent in Belarus and some central Asian economies.[27]
Chart A.3
Gold accumulators in 2022 tended to be geopolitically aligned with China and Russia
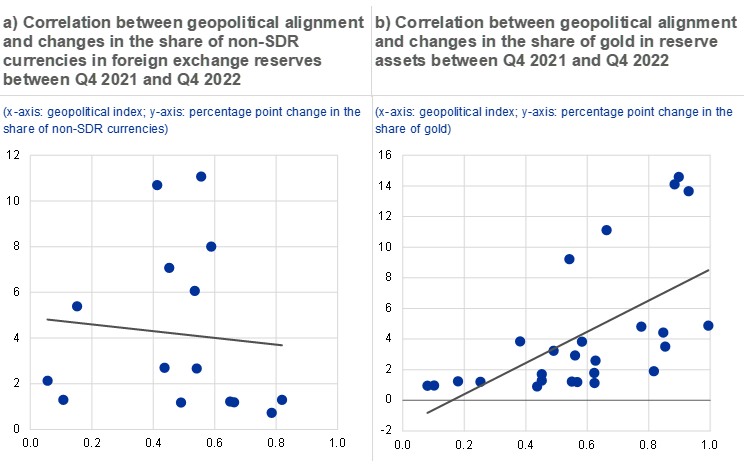
Sources: ECB calculations based on the Global Sanctions Database (GSDB), SIPRI Arms Transfers Database, Green Finance & Development Center, the United Nations, World Gold Council and the IMF.
Notes: The scatterplot includes countries that increased the share of gold or non-SDR currencies in their official foreign reserves more than the average change across all countries. The share of gold in total reserves is calculated using World Gold Council data. The geopolitical index measures the closeness of a country to the country pair China-Russia versus the United States. A higher value of the index indicates that a country is closer to China-Russia than to the United States. See Box A for further details on the construction of the index.
Finally, China’s holdings of US Treasury securities significantly declined in 2022, reaching their lowest level since 2010; nevertheless, it is not obvious to what extent this decrease was the result of attempts to decouple from the dollar or of other factors. Chart A.4 plots the changes in holdings of US Treasury securities for the 20 largest holders. As of January 2023, the holdings by China declined by almost USD 200 billion or by around 10 percentage points relative to December 2021. Valuation effects owing to the fall in US bond prices may partly explain this large drop. Foreign exchange interventions to stem the broad appreciation of the US dollar in the course of 2022 might be another tentative explanation. The decline in the holdings of US Treasuries by Japan – the largest holder, politically aligned with United States – is of a similar magnitude to that of China. In addition, among the top holders of US Treasuries, there are no other countries that are geopolitically aligned with Russia or China whose holdings of US Treasuries significantly declined.
Chart A.4
There has been a large fall in the value of US Treasury securities held by China, but also by Japan
Change in the holdings of US Treasury securities between December 2021 and January 2023
(USD billions and percentages)
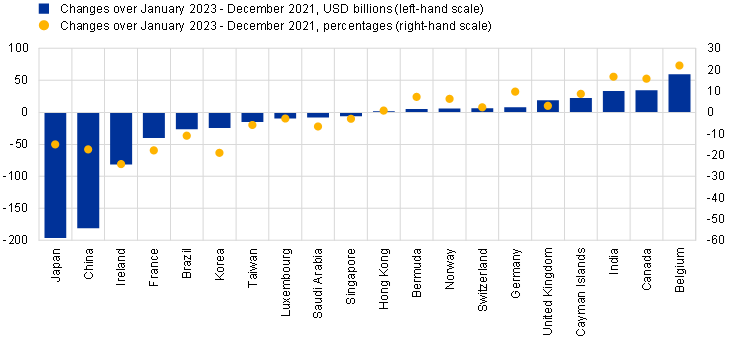
Sources: US Treasury International Capital System and ECB calculations.
Note: The chart includes the 20 largest holders of US Treasury securities in December 2021.
4 Preliminary evidence for other dimensions of international currency use
Heightened geopolitical fragmentation risks could impact not only the composition of foreign exchange reserves but also other dimensions of international currency use. The ban of selected Russian banks from SWIFT – which was part of a package of sanctions imposed on Russia following the invasion of Ukraine – has fuelled speculation that Russia and other countries that are not geopolitically aligned with the United States could move their international payments to systems alternative to SWIFT.[28] One such alternative could be China’s cross-border interbank payment system (CIPS), launched in 2015, which clears payments in renminbi, although volumes – at roughly 1% of those handled by the SWIFT system – remain small. Russia’s own alternative to SWIFT, the System for Transfer of Financial Messages (SPFS), was developed in 2014 after Russia annexed the Crimean Peninsula. Although the system has grown over the past year, with foreign participants joining, its scope is still limited and it faces several challenges, such as higher transaction costs compared with SWIFT. More generally, countries might seek to reduce their dependence on currencies issued by sanctioning countries by reducing their cross-border payments in these currencies. There is inconclusive evidence that this is happening, however. Chart A.5 shows how the shares of currencies issued by countries that have not sanctioned Russia have marginally increased. However, the shares of currencies of most sanctioning countries, which are not shown in Chart A.5, such as the US dollar, Japanese yen and pound sterling, also increased, with the exception of the euro. The share of the rouble collapsed, reflecting the ban on Russian banks in the SWIFT system.
Chart A.5
The evidence on whether non-standard currencies are increasingly used in global payments to avoid sanctions is inconclusive so far
Share of global payments in SWIFT of selected currencies, excluding payments within the euro area
(percentages)
Sources: SWIFT and ECB calculations.
Notes: The data refer to the currency shares of messages exchanged on SWIFT in the total value of selected currencies, excluding payments within the euro area. Data on the top 20 currency shares are available, meaning that if a currency does not make this cut-off point, the value of the currency will be zero in the chart.
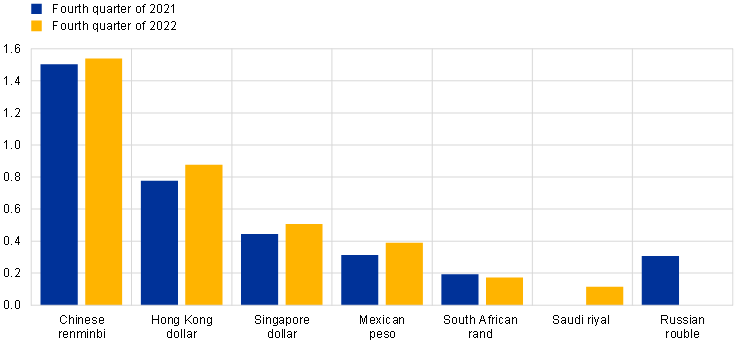
Anecdotal evidence, including official statements, pointing to the intention of some countries to use alternative currencies for invoicing international trade was more ample in 2022. Press reports published after Russia’s invasion of Ukraine provide additional anecdotal evidence about the intentions of officials in Russia, China, India, Türkiye and Saudi Arabia to reduce the weight of the US dollar and the euro in bilateral trade transactions, including commodities transactions, as shown in Table A.1. Implementation is not without challenges, however. For example, press reports suggest that after Russia requested Indian refineries to settle trade in Russian oil in United Arab Emirates dirhams in July 2022, this did not occur until January 2023 as one intermediary bank declined to facilitate transactions.[29] Similarly, although the Reserve Bank of India applied a new mechanism to settle international transactions in rupees in July 2022, press reports suggest that Russian counterparts indicated that Indian banks have only used the system to a limited extent, owing to concerns about secondary sanctions.[30] Finally, recent research suggests that sanctions imposed on Russia at the time of the annexation of Crimea in 2014 led to increases in trade invoicing in roubles at the expense of US dollars in some cases.[31] Additional evidence suggests that the share of Russia’s trade in goods invoiced in roubles and in Chinese renminbi rose substantially in 2022, mainly at the expense of the US dollar and the euro. In particular, the share of Russia’s trade invoiced in renminbi increased to 16% in December 2022 from virtually zero just before the invasion of Ukraine (Chart A.6, panel a). In parallel, use of the renminbi in cross-border payments by Russia increased sizeably – Russia was among the top six countries for offshore renminbi payments in December 2022, with a share of almost 2% (Chart A.6, panel b).[32] In the last quarter of 2022, the share of the renminbi in global trade finance doubled to around 4% compared with the last quarter of the previous year.
Chart A.6
There is evidence of a stronger role of the Chinese renminbi in Russia’s international trade invoicing and cross-border payment patterns

Sources: Central Bank of Russia and SWIFT.
Notes: Panel b shows the share of Russia in total offshore renminbi cross-border payments excluding China. In January 2022 Russia was not in the top 15 countries for renminbi offshore payment volumes and for this reason its share is not reported by SWIFT. For that period Russia’s share is approximated using the smallest share reported by SWIFT.
Finally, there is scant evidence of diversification of private and official Russian investments into cryptocurrencies, defying earlier speculation that these would be a pre-eminent conduit to evade sanctions. In the immediate aftermath of Russia’s invasion of Ukraine observers speculated that sanctions could usher in a diversification of private and official assets into cryptocurrencies as a vehicle to circumvent the sanctions.[33] Although Iran uses cryptocurrencies to pay for some of its imports[34], the size of Russia’s imports is too large in comparison with the liquidity of global cryptocurrency markets.[35] Nevertheless, as reported in Table A.1, Russia and Iran are discussing the possibility of introducing a gold-backed stablecoin for foreign trade settlements, and the two countries plan to link their interbank payment messaging systems after being disconnected from SWIFT.[36]
5 Concluding remarks
So far, the geopolitical shock triggered by Russia’s invasion of Ukraine has not challenged the conventional view that the global appeal of currencies is subject to substantial inertia effects, which benefit incumbent currencies such as the US dollar and the euro. Evidence of fragmentation risks materialising in the international monetary system remains so far mainly restricted to announcements and specific cases – such as the invoicing of Russia’s international trade – rather than pointing to broader trends. Evidence that some countries intend to develop the use of alternatives to major traditional reserve currencies, notably for international trade, remains anecdotal. Apart from significant gold accumulation in official reserve holdings, the available data do not point to substantial changes in the international monetary system. Overall, Russia’s invasion has revealed the lack of obvious alternatives to the major international currencies, at least in the near future.
See Aiyar, S. et al. (2023), “Geoeconomic Fragmentation and the Future of Multilateralism”, Staff Discussion Note, No 2023/001, International Monetary Fund, Washington. See also ECB/ESCB International Relations Committee Work stream on Open Strategic Autonomy (2023), “The EU’s Open Strategic Autonomy from a central banking perspective”, European Central Bank, March.
See C. Lagarde, (2022), “A new global map: European resilience in a changing world”, Speech delivered at the Peterson Institute for International Economics, April.
One example is Russia, which cut its US dollar exposures significantly after the seizure of Crimea and the imposition of international sanctions in 2014.
See McDowell, D. (2021), “Financial sanctions and political risk in the international currency system”, Review of International Political Economy, Vol. 28, No 3, pp. 635-661 and Bianchi, J. and Sosa-Padilla, C. (2023), “International Sanctions and Dollar Dominance”, Working Paper, No 31024, National Bureau of Economic Research for a model containing this channel.
See the interview with Gita Gopinath in the Financial Times, 31 March 2022.
Gopinath, G. and Stein J.C. (2021), “Banking, Trade, and the Making of a Dominant Currency”, Quarterly Journal of Economics, Vol. 136, No 2, pp. 783-830.
See N. Roubini’s views in the Financial Times, 5 February 2023.
See Ahmed R. and Rebucci, A. (2022), “Dollar Reserves and U.S. Yields: Identifying the Price Impact of Official Flows”, Working Paper, No 30476, National Bureau of Economic Research, September.
See Brunnermeier, M., James, H. and Landau, J.-P. (2022), “Sanctions and the international monetary system”, VoxEU, April.
See the discussion in Box 1 entitled “The Russian invasion of Ukraine and international currencies”, The international role of the euro, European Central Bank, June 2022.
Gold held domestically is within the direct reach of foreign sanctions to a lesser extent and can only be exchanged for domestic currency, thus nullifying its role as a reserve asset.
For example, the crash of the algorithmic stablecoin TerraUSD in May 2022, the collapse of the cryptocurrency exchange FTX in November 2022 or the de-pegging of the stablecoin USD Coin in March 2023.
Weiss, C. (2022), “Geopolitics and the U.S. Dollar's Future as a Reserve Currency”, International Finance Discussion Papers, No 1359, Board of Governors of the Federal Reserve System, October.
See Folkerts-Landau, D., Garber, P. and Dooley, M. (2022), “Seizures of foreign exchange reserves will not weaken the dollar’s role as dominant reserve currency”, VoxEU, May.
Currencies that are part of the IMF’s Special Drawing Rights (SDR) basket are the US dollar, euro, Japanese yen, pound sterling and the Chinese renminbi, the latter since October 2016. All other reserve currencies are referred to as non-SDR currencies.
See Arslanalp, S., Eichengreen, B. and Simpson-Bell, C. (2022), “The Stealth Erosion of Dollar Dominance and the Rise of Nontraditional Reserve Currencies”, Journal of International Economics, Vol. 138, No 103656, September.
Since in this special feature shares are reported at current exchange rates, valuation effects stemming from the broad-based appreciation of the US dollar may be an additional explanation.
See Arslanalp, S., Eichengreen, B. and Simpson-Bell, C. (2023), “Gold as International Reserves: A Barbarous Relic No More?”, IMF Working Paper, No 2023/014, Washington, January.
See World Gold Council (2023), “Gold Demand Trends Full Year 2022”, January. For example, the Central Bank of Russia stopped reporting its gold purchases one month before the sanctions were imposed, although it is expected to have been a large purchaser in 2022. Data are reported to the IMF on a voluntary basis. The WGC complements IMF data with other proprietary data sources, such as Metals Focus and Refinitiv GFMS metals research, to obtain estimates on gold purchases.
Felbermayr, G., Kirilakha, A., Syropoulos, C., Yalcin, E. and Yotov, Y.V. (2020), “The Global Sanctions Data Base”, European Economic Review, Vol. 129, October; Felbermayr, G., Kirilakha, A., Syropoulos, C., Yalcin, E. and Yotov, Y.V. (2021), “The Global Sanctions Data Base: An Update that Includes the Years of the Trump Presidency”, School of Economics Working Paper Series, No 2021-10, LeBow College of Business, Drexel University; and Felbermayr, G., Kirilakha, A., Syropoulos, C., Yalcin E. and Yotov, Y.V. (2022), “The Global Sanctions Data Base – Release 3: COVID-19, Russia, and Multilateral Sanctions”, School of Economics Working Paper Series, No 2022-11, LeBow College of Business, Drexel University.
Arslanalp et al. (2023), op. cit.
Bhattacharya, A., Dollar, D., Doshi, R., Hass, R., Jones, B., Kharas, H., Mason, J., Solis, M. and Stromseth, J. (2019), “China’s Belt and Road: The New Geopolitics of Global Infrastructure Development; A Brookings Interview”.
The resolution deplored Russia’s invasion of Ukraine and demanded full withdrawal of Russian forces and a reversal of Russia’s decision to recognise the self-proclaimed “people’s republics” of Donetsk and Luhansk. See, for example, Dreher, A., Fuchs, A., Parks, B., Strange, A. and Tierney, M.J. (2021), “Aid, China, and Growth: Evidence from a New Global Development Finance Dataset”, American Economic Journal: Economic Policy, Vol. 13, No 2, pp. 135-174, May.
Active diversifiers are countries with above-average increases in the share in question, in the spirit of Arslanalp et al. (2022 and 2023), op. cit.
Active diversifiers are countries with above-average increases in the share of gold.
This positive coefficient is statistically significant and robust to outliers. Robustness checks show that constructing the geopolitical alignment index with respect to China versus the United States or with respect to Russia versus the United States, as separate dependent variables, produces similar results. Finally, the results are also robust to the inclusion of inflation in 2022 as an additional control variable.
For instance, Kyrgyzstan, Tajikistan and Uzbekistan. These countries, together with Belarus, have been identified as geopolitically close to Russia in a similar index developed by The Economist (March 2023).
SWIFT is a global messaging network through which international payments between banks are conducted.
See “Indian refiners pay dollars for Russian oil after dirham attempts fail”, Reuters, September 2022.
See news article on concerns at Indian banks surrounding US sanctions.
The evidence is available for French firms (see Berthou, A. (2023), “International sanctions and the dollar: Evidence from trade invoicing”, mimeo).
As of March 2023, Hong Kong accounts for the bulk of renminbi offshore payments (73% of total payments excluding China) as reported by SWIFT. In the ranking of major centres for offshore renminbi payments, Russia holds fifth place after the United Kingdom, Singapore and the United States.
See news report speculating that Russia could use cryptocurrencies to evade sanctions.
See news report on Iran using cryptocurrency to pay for imports.
See the Center for Strategic and International Studies Q&A on the implications for Russia regarding cryptocurrencies and US sanctions evasion. See also Ahari, A., Duong, J., Hanzl, J., Lichtenegger, E.M., Lobnik, L. and Timel, A. (2022) “Is it easy to hide money in the crypto economy? The case of Russia”, OeNB Focus on European Economic Integration Q4/22, Oesterreichische Nationalbank, December.
There is evidence that the Russian private sector faced challenges in finding alternatives to the western financial system to park assets for the first half of 2022. A recent study found that Russian firms had accumulated approximately USD 100 billion in foreign assets up to June 2022 and that the bulk of these funds were located in sanctioning jurisdictions (see Cocozza, E., Corneli, F., Della Corte, V. and Savini Zangrandi, M. (2023), “In search of Russia’s foreign assets”, VoxEU, January.