
ECB speciālistu 2025. gada marta makroekonomiskās iespēju aplēses eurozonai
1. Pārskats
Paredzams, ka ilgstoši augstā ģeopolitiskā un politikas nenoteiktība nelabvēlīgi ietekmēs eurozonas tautsaimniecības izaugsmi, palēninot gaidāmo atveseļošanos. Tas atbilst nedaudz vājākai, nekā gaidīts, izaugsmei 2024. gada beigās. Gan iekšzemes, gan tirdzniecības politikas nenoteiktība ir liela. Lai gan pamataplēsē ņemta vērā tikai jauno ASV un Ķīnas tirdzniecības tarifu ietekme, tiek pieņemts, ka negatīvā ietekme, ko rada nenoteiktība par iespējamu turpmāku pasaules tirdzniecības politikas pārmaiņu iespēju, īpaši attiecībā pret Eiropas Savienību, nelabvēlīgi skars eurozonas eksportu un ieguldījumus. Tiek vērtēts, ka kopā ar ilgstošajām konkurētspējas problēmām tas vēl vairāk samazinās eurozonas eksporta tirgus daļu. Neraugoties uz šiem kavējošajiem faktoriem, saglabājas nosacījumi, lai eurozonas IKP pieaugums iespēju aplēšu periodā atkal kļūtu spēcīgāks. Gaidāms, ka reālās darba samaksas un nodarbinātības kāpums spēcīga darba tirgus apstākļos, kurā gan vērojams aktivitātes kritums, veicinās atveseļošanos. Galvenais izaugsmes veicinātājs joprojām ir patēriņš. Finansēšanas nosacījumu atvieglošanai, par ko liecina tirgus gaidas par procentu likmju nākotnes virzību, būtu jāveicina arī iekšzemes pieprasījums. Darba tirgum arī turpmāk vajadzētu būt noturīgam, un paredzams, ka bezdarba līmenis 2025. gadā būs vidēji 6.3 %, 2027. gadā samazinoties līdz 6.2 %. Tā kā sāk izzust daži cikliskie faktori, kuri pēdējā laikā mazinājuši darba ražīgumu, gaidāms, ka darba ražīgums aplēšu periodā pieaugs, lai gan saglabājas strukturālas problēmas. Kopumā gaidāms, ka gada vidējais reālā IKP pieaugums 2025. gadā būs 0.9 % un pēc tam kļūs spēcīgāks, 2026. gadā pieaugot līdz 1.2 % un 2027. gadā – līdz 1.3 %. Salīdzinājumā ar Eurosistēmas speciālistu 2024. gada decembra makroekonomiskajām iespēju aplēsēm IKP pieauguma perspektīva 2025. un 2026. gadam koriģēta un pazemināta par 0.2 procentu punktiem, bet 2027. gadam nav mainīta. Vājāka pieauguma perspektīva galvenokārt skaidrojama ar eksporta un – mazākā mērā – ieguldījumu lejupvērstajām korekcijām, atspoguļojot spēcīgāku nenoteiktības ietekmi, nekā iepriekš pieņemts, kā arī gaidas, ka konkurētspējas problēmas, visticamāk, saglabāsies ilgāk, nekā tika domāts.[1]
Kopējā SPCI inflācija pēdējos mēnešos palielinājusies, bet paredzams, ka 2025. gadā tā nedaudz samazināsies un pēc tam, sākot ar 2026. gada 1. ceturksni, saruks un svārstīsies ap ECB noteikto 2.0 % inflācijas mērķi. Gaidāms, ka iespēju aplēšu perioda sākumā enerģijas komponenta augšupvērstie bāzes efekti un augstāka pārtikas cenu inflācija pamatā kompensēs SPCI inflācijas (neietverot enerģijas un pārtikas cenas; SPCIX) krituma lejupvērsto ietekmi. Enerģijas izejvielu cenu pieaugums gadumijā atspoguļosies enerģijas cenu gada pārmaiņu tempā 2025. gadā. Lai gan tiek pieņemts, ka naftas un gāzes cenas samazināsies atbilstoši biržā tirgoto nākotnes līgumu cenām, enerģijas cenu inflācija visā iespēju aplēšu periodā, visticamāk, joprojām būs pozitīva, lai gan zemāka par vēsturisko vidējo līmeni. Tiek uzskatīts, ka 2027. gadā enerģijas cenu inflācijas kāpumu noteiks jaunu klimata pārmaiņu mazināšanas pasākumu ieviešana. Paredzams, ka pārtikas cenu inflācija līdz 2025. gada vidum palielināsies, un to galvenokārt noteiks nesenais spēcīgais pārtikas izejvielu cenu kāpums, bet pēc tam samazināsies līdz vidēji 2.2 % 2027. gadā. Gaidāms, ka SPCIX inflācija 2025. gada sākumā sāks pazemināties, izzūdot novēlotas pārcenošanas ietekmei, mazinoties darba samaksas spiedienam un agrāk īstenotās monetārās politikas stingrības palielināšanas ietekmei turpinot ietekmēt patēriņa cenas. Gaidāms, ka SPCIX inflācijas sarukumu galvenokārt noteiks līdz šim samērā noturīgās pakalpojumu cenu inflācijas samazinājums. Kopumā paredzams, ka SPCIX inflācija saruks no 2.2 % 2025. gadā līdz 1.9 % 2027. gadā. Darba samaksas pieaugumam vajadzētu turpināt samazināties salīdzinājumā ar pašreizējo joprojām paaugstināto līmeni, izzūdot inflācijas kompensācijas spiedienam. Paredzams, ka kopā ar gaidāmo darba ražīguma kāpuma atjaunošanos tas noteiks būtiski lēnāku vienības darbaspēka izmaksu palielināšanos. Tādējādi paredzams, ka iekšzemes cenu spiediens turpinās mazināties, peļņas maržām iespēju aplēšu periodā atveseļojoties. Pieņemot, ka ES tirdzniecības tarifu politika nemainīsies, gaidāms, ka ārējais cenu spiediens, ko atspoguļo importa cenas, joprojām būs mērens. Salīdzinājumā ar 2024. gada decembra iespēju aplēsēm kopējās SPCI inflācijas perspektīva 2025. gadam koriģēta un paaugstināta par 0.2 procentu punktiem saistībā ar pieņēmumiem par augstākām enerģijas izejvielu cenām un euro kursa kritumu, savukārt 2027. gadam tā koriģēta un nedaudz pazemināta saistībā ar nedaudz vājāku enerģijas komponenta perspektīvu iespēju aplēšu perioda beigās.
Tirdzniecības un fiskālās politikas paziņojumi pēc šo iespēju aplēšu pabeigšanas vairojuši nenoteiktību par tautsaimniecības izaugsmes un inflācijas perspektīvu eurozonā.
1. tabula
Izaugsmes un inflācijas iespēju aplēses eurozonai
(pārmaiņas salīdzinājumā ar iepriekšējā gada atbilstošo periodu; %; korekcijas procentu punktos)
| 2025. gada marts | Korekcijas salīdzinājumā ar | ||||||
|---|---|---|---|---|---|---|---|---|
2024 | 2025 | 2026 | 2027 | 2024 | 2025 | 2026 | 2027 | |
Reālais IKP | 0.8 | 0.9 | 1.2 | 1.3 | 0.1 | –0.2 | –0.2 | 0.0 |
SPCI | 2.4 | 2.3 | 1.9 | 2.0 | 0.0 | 0.2 | 0.0 | –0.1 |
SPCI (neietverot enerģijas un pārtikas cenas) | 2.8 | 2.2 | 2.0 | 1.9 | –0.1 | –0.1 | 0.1 | 0.0 |
Piezīmes. Reālā IKP datu pamatā ir sezonāli un atbilstoši darbadienu skaitam koriģēti gada vidējie dati. Vēsturiskie dati var atšķirties no jaunākajām Eurostat publikācijām, jo dati tiek publiskoti pēc iespēju aplēšu datu aktualizēšanas pēdējā datuma. Korekcijas aprēķina, izmantojot noapaļotus skaitļus. Datus, t. sk. arī ceturkšņa datus, var lejupielādēt makroekonomisko iespēju aplēšu datubāzē ECB interneta vietnē.
2. Starptautiskā vide
Globālās izaugsmes temps 2024. gada beigās īslaicīgi pastiprinājās, bet nesenā ASV tirdzniecības politika rada kavējošu ietekmi.[2] Globālā izaugsme 2024. gada 4. ceturksnī palielinājās kopumā atbilstoši 2024. gada decembra iespēju aplēsēm, jo fiskālais stimuls vairoja aktivitāti Ķīnā un stabili mājsaimniecību tēriņi veicināja reālā IKP pieaugumu ASV. Saņemtie dati liecina par nelielu globālās izaugsmes palēnināšanos 2025. gada 1. ceturksnī, agrīnām pazīmēm liecinot par tempa kritumu pakalpojumu nozarē, kas 2024. gada 2. pusgadā bija galvenais izaugsmes virzītājspēks, un vienlaikus saglabājoties joprojām vājai apstrādes rūpniecības nozarei. Turklāt, ASV nākot klajā ar paziņojumiem par tarifiem, kopš 2024. gada novembra palielinājusies tirdzniecības politikas nenoteiktība, un gaidāms, ka tā kavēs globālās investīcijas.
2. tabula
(pārmaiņas salīdzinājumā ar iepriekšējā gada atbilstošo periodu; %; korekcijas procentu punktos)
| 2025. gada marts | Korekcijas salīdzinājumā ar | ||||||||
|---|---|---|---|---|---|---|---|---|---|---|
2024 | 2025 | 2026 | 2027 | 2024 | 2025 | 2026 | 2027 | |||
Pasaules reālais IKP (neietverot eurozonu) | 3.4 | 3.4 | 3.2 | 3.2 | 0.0 | –0.1 | –0.1 | 0.0 | ||
Globālā tirdzniecība (neietverot eurozonu)1) | 4.4 | 3.5 | 3.1 | 3.2 | 0.4 | –0.1 | –0.2 | 0.0 | ||
Eurozonas ārējais pieprasījums2) | 3.4 | 3.2 | 3.1 | 3.1 | 0.3 | –0.3 | –0.2 | –0.1 | ||
Pasaules PCI (neietverot eurozonu) | 4.2 | 3.3 | 2.7 | 2.5 | 0.0 | 0.1 | –0.1 | –0.1 | ||
Konkurentu eksporta cenas nacionālajā valūtā3) | 2.3 | 1.7 | 2.3 | 2.1 | 0.1 | 0.0 | 0.0 | 0.0 | ||
Piezīme. Korekcijas aprēķina, izmantojot noapaļotus skaitļus.
1) Aprēķina kā importa vidējo svērto apjomu.
2) Aprēķina kā eurozonas tirdzniecības partnervalstu importa vidējo svērto apjomu.
3) Aprēķina kā eurozonas tirdzniecības partnervalstu eksporta deflatoru vidējo svērto apjomu.
Paredzams, ka pasaules tautsaimniecības izaugsme joprojām būs lēna, iespēju aplēšu periodā nedaudz samazinoties. Paredzams, ka pasaules reālais IKP 2025. gadā palielināsies par 3.4 %, līdzīgi kā 2024. gadā, bet 2026. un 2027. gadā samazināsies līdz 3.2 % (2. tabula). 2025. gada marta iespēju aplēses ietver papildu ASV tarifus Ķīnai un Ķīnas daļējo atbildes reakciju (sk. 2. ielikumu), lai gan no ASV sniegtajiem tirdzniecības politikas paziņojumiem joprojām grūti noteikt šo tarifu piemērošanas laiku un apmēru. Šie tarifi papildina ASV politiku, kas jau ietverta 2024. gada decembra iespēju aplēsēs, proti, stingrāku imigrācijas politiku un iedzīvotāju un uzņēmumu ienākuma nodokļa samazinājumu pagarināšanu, kuru beigu termiņš bija noteikts 2025. gadā. Salīdzinājumā ar 2024. gada decembra iespēju aplēsēm globālā izaugsme 2025. un 2026. gadā koriģēta un samazināta par 0.1 procentu punktu, jo nesen noteiktie tarifi un ilgstoši augstā tirdzniecības politikas nenoteiktība nelabvēlīgi ietekmē aktivitāti. Nelielais globālā IKP pieauguma sarukums 2026. un 2027. gadā atspoguļo gaidāmo ekonomikas lejupslīdi Ķīnā nelabvēlīgas demogrāfiskās situācijas dēļ, kā arī lēnāku izaugsmi ASV politikas (piemēram, mazāka imigrācija) negatīvās vidēja termiņa ietekmes dēļ. 2. ielikumā aplūkoti riski, kas saistīti ar turpmākiem ASV tarifiem papildus tiem, kas pašlaik ietverti 2025. gada marta iespēju aplēsēs.
Paredzams, ka pasaules tirdzniecības izaugsme palēnināsies, ņemot vērā mazāk labvēlīgu pieprasījuma struktūru, paaugstinātu tirdzniecības politikas nenoteiktību un ASV tarifu ietekmi uz Ķīnu. Pasaules tirdzniecību 2024. gadā zināmā mērā stimulēja uzņēmumi, kuri veica ārvalstu izejvielu importa priekšpiegādes, gatavojoties iespējamiem tirdzniecības traucējumiem, īpaši ASV. Tomēr gaidāms, ka šis īslaicīgais faktors pakāpeniski izzudīs. Ņemot to vērā, gaidāms, ka pasaules tirdzniecības apjoms 2025. gadā saruks sakarā ar mazāk labvēlīgu aktivitātes struktūru – agrāk veikto priekšpiegāžu dēļ – un paaugstinātu tirdzniecības politikas nenoteiktību. Turklāt gaidāms, ka pasaules tirdzniecību iespēju aplēšu periodā būtiski ietekmēs ASV un Ķīnas divpusējie tirdzniecības tarifi. Paredzams arī, ka eurozonas ārējā pieprasījuma pieaugums palēnināsies, sarūkot no 3.4 % 2024. gadā līdz 3.2 % 2025. gadā un pēc tam līdz 3.1 % 2026. un 2027. gadā. Pasaules tirdzniecības iespēju aplēšu lejupvērstās korekcijas salīdzinājumā ar 2024. gada decembra iespēju aplēsēm galvenokārt atspoguļo tarifu ietekmi uz ASV importu no Ķīnas.
Paredzams, ka iespēju aplēšu periodā saglabāsies globālās inflācijas sarukuma tendence, savukārt eurozonas konkurentu eksporta cenu kāpums svārstīsies, nedaudz pārsniedzot 2 % – tāpat, kā tika paredzēts decembra iespēju aplēsēs. Lai gan šķiet, ka kopējā patēriņa cenu indeksa (PCI) dezinflācija attīstītajās valstīs 2024. gada beigās apstājusies, paredzams, ka globālā inflācija atkal pakāpeniski pazemināsies no 4.2 % 2024. gadā līdz 2.5 % 2027. gadā. Gaidāms, ka attīstīto valstu darba tirgus aktivitātes mazināšanās noteiks nominālās darba samaksas inflācijas sarukumu, ļaujot kopējai inflācijai pakāpeniski tuvināties centrālo banku noteiktajiem mērķiem. Paredzams, ka arī attīstības valstīs kopējā inflācija pakāpeniski kritīsies. Salīdzinājumā ar 2024. gada decembra iespēju aplēsēm gaidāms, ka globālā inflācija 2025. gadā būs augstāka, atspoguļojot tarifu ietekmi uz patēriņa cenām ASV un Ķīnā, kā arī spēcīgāku inflācijas dinamiku gadu mijā, nekā iepriekš gaidīts. 2026. un 2027. gadā globālā inflācija koriģēta un pazemināta, jo tarifu augšupvērsto ietekmi ar uzviju kompensē lejupvērstas inflācijas korekcijas Ķīnā, sakarā ar spēcīgu ražotāju cenu deflāciju un piedāvājuma pārpalikuma ietekmi. Eurozonas konkurentu eksporta cenu kāpums (nacionālajā valūtā un gada izteiksmē) 2024. gadā kļuva pozitīvs, jo izzuda agrākā izejvielu cenu krituma ietekme. Gaidāms, ka iespēju aplēšu periodā tam vajadzētu turpināt svārstīties ap 2 % pamatā atbilstoši vēsturiski vidējam līmenim. Augstāku pasaules pārtikas cenu un zemāku Ķīnas ražotāju cenu kompensējošās ietekmes dēļ pieauguma profils kopumā nav mainījies salīdzinājumā ar 2024. gada decembra iespēju aplēsēm. Turklāt tarifu ietekme tiešāk atspoguļojas eurozonas konkurentu importa cenās, savukārt ietekme uz eksporta cenām ir samērā netieša, un tā parādās augstākās ražošanas izmaksās piegādes ķēdēs, īpaši ASV un Ķīnā.
1. ielikums
Tehniskie pieņēmumi
Salīdzinājumā ar 2024. gada decembra iespēju aplēsēm galvenās tehnisko pieņēmumu pārmaiņas ietver augstākas izejvielu cenas un zemāku valūtas kursu, savukārt pieņēmumi par procentu likmēm kopumā nav mainījušies. Pieņēmumi par naftas cenām 2025. gadā koriģēti un paaugstināti par 4 % un pārējā iespēju aplēšu periodā pamatā nav mainījušies, savukārt pieņēmumi par gāzes, elektroenerģijas un pirmās emisijas kvotu tirdzniecības sistēmas cenām koriģēti un būtiskāk paaugstināti visā iespēju aplēšu periodā. Tomēr pieņemts, ka enerģijas cenas iespēju aplēšu periodā turpinās samazināsies. Neenerģijas izejvielu cenas 2025. gadā koriģētas un paaugstinātas sakarā ar globālo pārtikas izejvielu cenu kāpumu. Kopš iepriekšējām iespēju aplēsēm euro kurss attiecībā pret ASV dolāru samazinājies par 2.1 % (nominālajā efektīvajā izteiksmē – par 1.0 %). Tirgus gaidas attiecībā uz īstermiņa un ilgtermiņa procentu likmēm pamatā nav mainījušās.
Tabula
| 2025. gada marts | Korekcijas salīdzinājumā ar | |||||||
|---|---|---|---|---|---|---|---|---|---|
2024 | 2025 | 2026 | 2027 | 2024 | 2025 | 2026 | 2027 | ||
Izejvielas | |||||||||
Naftas cena (ASV dolāros par barelu) | 82.0 | 74.7 | 70.3 | 68.7 | 0.2 | 4.0 | 0.2 | –0.7 | |
Dabasgāzes cenas (euro par MWh) | 34.4 | 50.2 | 40.4 | 31.7 | 0.2 | 17.2 | 15.5 | 8.2 | |
Elektroenerģijas vairumtirdzniecības cenas (euro par MWh) | 77.7 | 100.6 | 86.2 | 75.9 | 1.4 | 11.8 | 8.4 | 3.1 | |
Pirmās ES emisijas kvotu tirdzniecības sistēmas (ETS1) kvotas (euro par tonnu) | 65.2 | 80.5 | 83.1 | 85.5 | –0.3 | 15.6 | 15.7 | 15.4 | |
Otrās ES emisijas kvotu tirdzniecības sistēmas (ETS2) kvotas (euro par tonnu) | – | – | – | 59.0 | – | – | – | 0.0 | |
Neenerģijas izejvielu cenas (ASV dolāros; gada pārmaiņas; %) | 9.2 | 12.0 | –1.3 | –2.8 | 0.3 | 6.2 | –0.9 | –1.1 | |
Valūtas kursi | |||||||||
ASV dolāra kurss attiecībā pret euro | 1.08 | 1.04 | 1.04 | 1.04 | –0.1 | –2.2 | –2.1 | –2.1 | |
Euro nominālais efektīvais kurss (ENEK-41) (1999. gada 1. cet. = 100) | 124.1 | 122.2 | 122.2 | 122.2 | –0.1 | –1.0 | –1.0 | –1.0 | |
Finanšu pieņēmumi | |||||||||
3 mēnešu EURIBOR (gadā; %) | 3.6 | 2.2 | 2.0 | 2.1 | 0.0 | 0.0 | 0.0 | –0.1 | |
Valdības 10 gadu obligāciju ienesīguma likmes (gadā; %) | 2.9 | 2.9 | 3.0 | 3.2 | 0.0 | 0.0 | 0.0 | 0.0 | |
Piezīmes. Līmeņu korekcijas izteiktas procentos un pieauguma tempa un gada procentuālo rādītāju korekcijas – procentu punktos. Izaugsmes tempa un procentu likmju korekcijas aprēķina, izmantojot skaitļus, kas noapaļoti līdz vienam ciparam aiz komata, savukārt korekcijas, kas uzrādītas kā procentuālās pārmaiņas, aprēķina, izmantojot nenoapaļotus skaitļus. Tehniskie pieņēmumi par eurozonas procentu likmēm un izejvielu cenām balstīti uz tirgus gaidām atbilstoši stāvoklim 2025. gada 6. februārī. Naftas cenas ir Brent jēlnaftas tagadnes darījumu cenas un biržā tirgoto nākotnes līgumu cenas. Gāzes cenas ir Nīderlandes biržas gāzes tagadnes darījumu cenas un biržā tirgoto nākotnes līgumu cenas. Elektroenerģijas cenas ir piecu lielāko eurozonas valstu vidējās vairumtirdzniecības tagadnes darījumu cenas un biržā tirgoto nākotnes līgumu cenas. ETS1 kvotu (EUA) "sintētiskā" biržā tirgoto nākotnes līgumu cena atvasināta kā divu tuvāko Eiropas Enerģijas biržas EUA nākotnes līgumu lineāri interpolētā vērtība mēneša beigās. Pēc tam tiek noteiktas EUA biržā tirgoto nākotnes līgumu mēneša vidējās cenas, lai iegūtu gada rādītāja ekvivalentu. Tā kā ETS2 kvotas netiek tirgotas, speciālistu pieņēmumus par šīm cenām veido robežcena, virs kuras tiks atbrīvotas papildu kvotas, un šī cena aktualizēta atbilstoši 2027. gada cenām (sīkāku informāciju sk. Eurosistēmas speciālistu 2024. gada decembra makroekonomisko iespēju aplēšu 2. ielikumā). Uz izejvielu cenu tendencēm norāda biržā tirgoto nākotnes darījumu tirgi 10 darbadienu laikā pirms pēdējā datu aktualizēšanas termiņa. Pieņemts, ka divpusējie valūtu kursi iespēju aplēšu periodā nemainīsies salīdzinājumā ar vidējiem rādītājiem, kuri dominēja 10 darbadienu periodā, kas beidzās pēdējā datu aktualizēšanas dienā. Pieņēmumi par eurozonas valstu valdības 10 gadu obligāciju nominālajām ienesīguma likmēm balstās uz valstu 10 gadu obligāciju vidējām ienesīguma likmēm, kas svērtas ar IKP gada rādītājiem. Ja pieejami nepieciešamie dati, konkrētu valstu valdības 10 gadu obligāciju nominālās ienesīguma likmes tiek definētas kā 10 gadu etalonobligāciju ienesīguma likmes, ko pielāgo, izmantojot biržā netirgoto nākotnes līgumu nominālās ienesīguma likmes, kas pēdējā datu aktualizēšanas termiņā iegūtas no atbilstošajām attiecīgo valstu ienesīguma līknēm. Pārējām valstīm attiecīgās valsts 10 gadu obligāciju ienesīguma likmes tiek definētas kā 10 gadu etalonobligāciju ienesīguma likme, ko pielāgo, izmantojot nemainīgu uzcenojumu (kas novērots pēdējā datu aktualizēšanas termiņā) virs eurozonas bezriska ilgtermiņa procentu likmes tehniskā pieņēmuma.
2. ielikums
Tarifu ietekme uz 2025. gada marta iespēju aplēsēm
Jaunā ASV administrācija paziņojusi par plašu tarifu klāstu, no kuriem daži ietverti speciālistu 2025. gada marta iespēju pamataplēsē. Lai gan joprojām ir grūti noteikt ASV politikas paziņojumos minēto tarifu apmēru, pamataplēsē iekļauti tarifi, kas bija spēkā jau laikā, kad tika pabeigtas speciālistu 2025. gada marta iespēju aplēses (t. i., 2025. gada 19. februārī), proti, pirmā ASV un Ķīnas divpusējo tarifu pakete. Citi tarifi, kas vēl nebija ieviesti pēdējā datu aktualizēšanas termiņā (piemēram, ASV tarifi tēraudam un alumīnijam) vai kas tika atlikti (ASV tarifi Meksikai un Kanādai), vai kas tika paziņoti tikai nesen (ASV tarifi ES un papildu tarifi Ķīnai), nav ietverti pamataplēsē.
2025. gada marta pamataplēsē iekļautie tarifi ietver pirmo ASV un Ķīnas divpusējo tarifu paketi. Amerikas Savienotās Valstis 2025. gada 1. februārī paziņoja par papildu tarifu 10 procentu punktu apmērā visām Ķīnas precēm, iezīmējot būtisku soli pašreizējās tirdzniecības domstarpībās (attēls, a) panelis). Atbildot uz to, Ķīna noteica tarifus 80 ASV produktiem, t. sk. sašķidrinātajai dabasgāzei (LNG), oglēm un lauksaimniecības aprīkojumam, efektīvi palielinot kopējo efektīvo tarifu likmi ASV importa precēm par 1 procentu punktu. Turklāt Ķīna noteica tādu kritiski svarīgu metālu kā telūra un volframa eksporta aizliegumu. ASV tarifi tiek piemēroti visām Ķīnas precēm, kas veido 13 % no ASV importa, savukārt Ķīnas atbildes tarifi ir mērķētāki un ietekmē tikai 1 % no Ķīnas importa. Tomēr, nosakot šos pasākumus, kopējās efektīvās tarifu likmes abās valstīs pamatā bija līdzīgas.
ASV un Ķīnas divpusējo tarifu rezultātā veiktas nelielas ASV un Ķīnas izaugsmes un inflācijas iespēju aplēšu korekcijas. Tarifu ietekme aplēsta, izmantojot ECB makroekonomiskos modeļus, kas ietver vairākus semistrukturālus, daudzvalstu un daudznozaru modeļus. ASV inflācijas prognoze 2025. gadā koriģēta un paaugstināta par aptuveni 0.2 procentu punktiem. Tiek lēsts, ka tarifu izraisītā pirktspējas krituma rezultātā ASV reālā IKP pieauguma samazinājums 2025. gadā būs aptuveni 0.1 procentu punkts un 2026. gadā tas būs nenozīmīgs. Tiek uzskatīts, ka ASV tarifu ietekme uz Ķīnas tautsaimniecību ir diezgan neliela, lai gan lielāka nekā uz ASV tautsaimniecību, jo eksporta zaudējumi nozīmē Ķīnas reālā IKP pieauguma lejupvērsto korekciju aptuveni par 0.2 procentu punktiem 2025. gadā un turpmāku lejupvērsto korekciju par 0.1 procentu punktu kumulatīvi 2026. un 2027. gadā. Ietekme uz Ķīnas inflāciju ir neliela (kāpums par 0.1 procentu punktu salīdzinājumā ar 2025. gadu).
Šo divpusējo tarifu ietekme uz eurozonas iespēju aplēsēm ir ierobežota, lai gan Ķīna varētu atkārtot agrākās tirdzniecības novirzīšanas tendences. 2018. gadā ASV tarifi Ķīnas precēm izraisīja Ķīnas eksporta pārvirzīšanu uz citiem tirgiem, jo ASV piegādes ķēdes tika pārkonfigurētas, lai samazinātu tiešos piegādes avotus no Ķīnas. Ja Ķīna novirzīs eksportu no ASV, eurozonas konkurētspēja var mazināties gan iekšzemē, gan trešo valstu tirgos. Vienlaikus eurozonas potenciāls iegūt tirgus daļu ASV var būt ierobežots sakarā ar tās eksporta groza kvalitātes un cenu atšķirībām salīdzinājumā ar Ķīnu. Tomēr kopumā gaidāms, ka šo tarifu ietekme uz eurozonas izaugsmi būs tikai nedaudz negatīva. Attiecībā uz eurozonas inflāciju tiek uzskatīts, ka pamataplēsē iekļautajiem tarifiem ir neliela ietekme, jo gaidāms, ka to augšupvērsto ietekmi uz importa cenām, ko rada augstākas izmaksas piegādes ķēdēs, kopumā kompensēs Ķīnas preču, kuras tā piedāvās Eiropas tirgos, apjoma kāpuma lejupvērstā ietekme.
Izsludinātie tarifi arī vairojuši tirdzniecības politikas nenoteiktību, kā rezultātā veiktas pasaules un eurozonas ekonomiskās aktivitātes perspektīvas lejupvērstas korekcijas. Kopš ASV prezidenta vēlēšanām strauji palielinājusies tirdzniecības politikas nenoteiktība (attēls, b) panelis). Tiek lēsts, ka tā mazinās ieguldījumus un eksportu un – mazākā mērā – patēriņu, jo uzņēmumi un patērētāji iekšzemē un ārvalstīs pieņem piesardzīgāku nostāju attiecībā uz tēriņiem neprognozējamas tirdzniecības vides apstākļos. Gaidāms, ka tirdzniecības politikas nenoteiktības pieaugums pēdējos mēnešos mazinās pasaules (neietverot eurozonu) ekonomisko izaugsmi par aptuveni 0.1 procentu punktu 2025. un 2026. gadā, sarūkot ieguldījumiem un eksportam. Tā kā eurozonas tautsaimniecība ir atvērtāka un tās eksporta struktūra vērsta uz ilglietojuma precēm, gaidāms, ka ietekme uz to būs nedaudz spēcīgāka, reālā IKP pieaugumam 2025. un 2026. gadā kumulatīvā izteiksmē sarūkot aptuveni par 0.2 procentu punktiem. Ar to skaidrojama aptuveni puse no eurozonas izaugsmes kumulatīvajām lejupvērstām korekcijām speciālistu 2025. gada marta iespēju aplēsēs.
Attēls
ASV un Ķīnas efektīvās tarifu likmes un tirdzniecības politikas nenoteiktības dinamika
a) Efektīvās tarifu likmes | b) Tirdzniecības politikas nenoteiktība |
|---|---|
(%) | (indekss) |
 |  |
Avoti: OECD TiVA, CEPII BACI, PIIE, Haver Analytics, Caldara, D., Iacoviello, M., Molligo, P., Prestipino, A. and Raffo, A., The economic effects of trade policy uncertainty ("Tirdzniecības politikas nenoteiktības ietekme uz tautsaimniecību"), Journal of Monetary Economics, Vol. 109, January 2020, pp. 38-59, un ECB speciālistu aprēķini.
Piezīmes. Tarifi a) panelī pirms jaunākajiem paziņojumiem balstās uz ieņēmumu pieeju, izmantojot 2024. gada datus. Papildu tarifus aprēķina, piemērojot izsludinātajiem tarifiem svērumu atbilstoši to preču, uz kurām attiecas tarifi, importa īpatsvaram. Pelēkais laukums b) panelī apzīmē D. Trampa pirmās prezidentūras laiku. Tirdzniecības politikas nenoteiktības indeksa pamatā izmantota automatizēta teksta meklēšana septiņos laikrakstos (Boston Globe, Chicago Tribune, Guardian, Los Angeles Times, New York Times, Wall Street Journal un Washington Post). Rādītāju aprēķina, saskaitot, cik reizes mēnesī katrā laikrakstā rakstos apspriesta tirdzniecības politikas nenoteiktība (kā īpatsvars no ziņu rakstu kopējā skaita). Pēc tam šis indekss tiek normalizēts līdz vērtībai 100 par 1 % rakstu īpatsvaru (sk. tirdzniecības politikas nenoteiktības indeksa interneta vietni).
Kanādai un Meksikai noteikto ASV tarifu, kas nav iekļauti speciālistu 2025. gada marta pamataplēsēs, ietekme varētu būt būtiska, īpaši attiecībā uz šo tarifu skartajām valstīm. Tarifi Meksikai un Kanādai tika izsludināti 1. februārī, bet dažas dienas vēlāk tie tika atlikti. 2025. gada marta iespēju aplēšu pabeigšanas laikā tie joprojām bija pārāk neskaidri, lai tos varētu iekļaut pamataplēsē. Simulācijas, izmantojot ECB globālo modeli, liecina, ka šādu tarifu dēļ kumulatīvā izteiksmē iespēju aplēšu periodā varētu būtiski palielināties inflācija (par 0.6 procentu punktiem) un samazināties ASV reālā IKP pieaugums (par 0.1 procentu punktu). Papildu simulācijas, izmantojot ECB BASE un ECB globālos modeļus, liecina, ka kompensējošo spēku dēļ ietekme uz eurozonas reālo tautsaimniecību būtu ierobežota – konkurētspējas uzlabošanās euro zonā atsvērtu globālā pieprasījuma kritumu. Tomēr ietekme uz cenām eurozonā varētu būt nedaudz negatīva.
Papildu paziņojumi par ASV tarifiem, kas nebija noteikti speciālistu 2025. gada marta iespēju aplēšu sagatavošanas laikā, arī nav ietverti pamataplēsē, jo šo tarifu piemērošana saistīta ar lielu nenoteiktību. ASV administrācija 10. februārī paziņoja, ka 12. martā tiks atjaunota 25 % tarifa likme tēraudam un alumīnijam. Tā kā šo preču īpatsvars ASV importā ir neliels (2 %), gaidāms, ka ietekme kopumā būs ierobežota. Prezidents Tramps 12. februārī uzdeva padomniekiem izstrādāt visaptverošu plānu attiecībā uz tā dēvētajiem savstarpējiem tarifiem, 18. februārī paziņoja par globāliem tarifiem vieglajiem automobiļiem, farmācijas produktiem un pusvadītājiem, 21. februārī aicināja pārskatīt tirdzniecības partnerus digitālo pakalpojumu jomā, 25. februārī uzsāka izmeklēšanu par varam piemērojamiem tarifiem un 26. februārī paziņoja par 25 % tarifu noteikšanu importam no Eiropas, kā arī 27. februārī nāca klajā ar papildu 10 % tarifiem importam no Ķīnas. Visbeidzot, tirdzniecības politikas memorands "Amerika pirmajā vietā", ko prezidents Tramps parakstīja 2025. gada 20. janvārī, varētu pavērt ceļu papildu tarifiem, īpaši, pamatojoties uz valsts drošību. Kopumā pašlaik valda liela nenoteiktība attiecībā uz nākotnes tarifu mērķi, apmēru un ieviešanas laiku, kā arī attiecībā uz to valstu reakciju, kurām šie tarifi tiktu piemēroti. Ņemot vērā eurozonas tautsaimniecības lielo atvērtības pakāpi un to, ka ASV ir tās galvenā tirdzniecības partnervalsts, turpmākie ASV administrācijas ieviestie tarifi un ar tiem saistītā nenoteiktība rada riskus eurozonas tautsaimniecības perspektīvai.
3. Reālā tautsaimniecība
Eurozonas ekonomiskā aktivitāte 2024. gada 4. ceturksnī pieauga par 0.1 % (1. attēls). Privātā un valdības patēriņa devums izaugsmē bija pozitīvs, lai gan to lielā mērā kompensēja eksporta sarukums. Rezultāti bija par 0.1 procentu punktu zemāki, nekā tika prognozēts speciālistu 2024. gada decembra iespēju aplēsēs. To noteica vājāks eksports, lai gan reālā IKP pieaugums iepriekšējos ceturkšņos tika koriģēts un nedaudz paaugstināts. Gan privātais, gan valdības patēriņš 2024. gada 2. pusgadā bija nedaudz spēcīgāks, nekā gaidīts. Runājot par dažādām nozarēm, rūpniecības aktivitāte 4. ceturksnī, visticamāk, turpināja samazināties sakarā ar vājāku preču pieprasījumu, agrāk īstenotās monetārās politikas stingrības palielināšanas joprojām negatīvo ietekmi, turpmāku konkurētspējas samazināšanos un būtisku tirdzniecības politikas nenoteiktību. Aktivitāte pakalpojumu sektorā, visticamāk, turpināja palielināties.
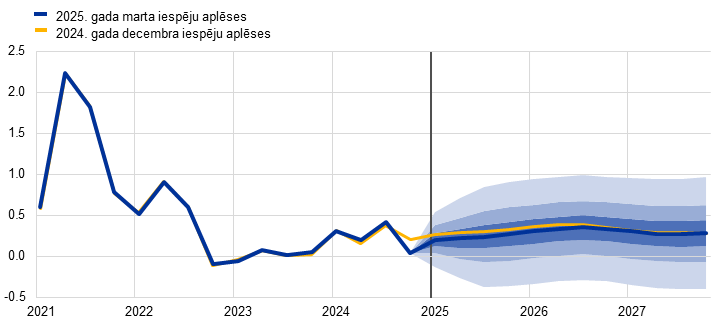
1. attēls
a) Reālā IKP pieaugums
(pārmaiņas salīdzinājumā ar iepriekšējā ceturkšņa atbilstošo periodu; %; sezonāli un atbilstoši darbadienu skaitam koriģēti ceturkšņa dati)
b) Reālā IKP līmenis
(ķēdes indeksu veidā agregētie apjomi (2020. gads); mljrd. euro)
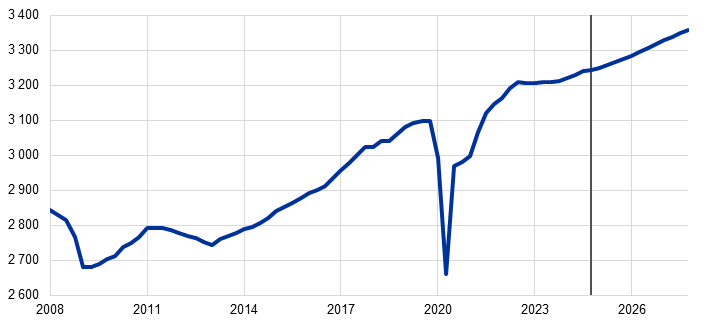
Piezīmes. Vēsturiskie dati var atšķirties no jaunākajām Eurostat publikācijām, jo dati tiek publiskoti pēc iespēju aplēšu datu aktualizēšanas pēdējā datuma. Vertikālā līnija norāda uz pašreizējā iespēju aplēšu perioda sākumu. Ar galveno iespēju aplēšu atainošanai izmantotajiem diapazoniem a) panelī novērtēta nenoteiktības pakāpe. Diapazoni ir simetriski. Tie balstās uz agrākām aplēšu kļūdām, veicot korekcijas, kas atspoguļo izņēmumus. Intervāli (no tumšākā līdz gaišākajam) atspoguļo 30 %, 60 % un 90 % varbūtību, ka reālā IKP pieauguma rādītājs iekļausies attiecīgajos intervālos. Sīkāku informāciju sk. ECB speciālistu 2023. gada marta makroekonomisko iespēju aplēšu eurozonai ielikumā "Ar aplēsēm saistītās nenoteiktības attēlojums".
Saņemtie dati liecina par mērenu izaugsmi 2025. gada sākumā, ko noteica pakalpojumu sektors. To mazināja būtiska iekšzemes un tirdzniecības politikas nenoteiktība. Apsekojumu rādītāji joprojām ir zemi, lai gan janvārī lielākā daļa šo rādītāju uzlabojās. Piemēram, apvienotais produkcijas izlaides iepirkumu vadītāju indekss (IVI) janvārī pieauga līdz 50.2 (2024. gada 4. ceturksnī – vidēji 49.3). Saņemtie dati joprojām liecina par nozaru atšķirībām. Rūpniecības nozare joprojām bija ļoti vāja – apstrādes rūpniecības produkcijas izlaides IVI janvārī turpināja sarukt. Vienlaikus turpināja palielināties pakalpojumu aktivitāte, janvārī pakalpojumu izlaides un jauno darījumu IVI pieaugot, kas liecināja par izaugsmes turpināšanos.[3] Lai gan pamataplēsē ņemta vērā tikai jauno ASV un Ķīnas tarifu ietekme, gaidāms, ka negatīvā ietekme, ko rada nenoteiktība par iespējamām turpmākām pasaules tirdzniecības politikas pārmaiņām, īpaši attiecībā pret Eiropas Savienību, nelabvēlīgi skars eurozonas eksportu un ieguldījumus (sk. 2. ielikumu). Kopumā paredzams, ka eurozonas ekonomiskā aktivitāte 2025. gada pirmajos trijos ceturkšņos pieaugs par 0.2 %.
Gaidāms, ka vidējā termiņā reālā IKP pieaugums nostiprināsies. To veicinās patēriņa kāpums, ieguldījumu un ārējā pieprasījuma pieaugums un agrāk īstenotās monetārās politikas stingrības palielināšanas ierobežojošās ietekmes izzušana (3. tabula). Mājsaimniecību pirktspējas turpmākam kāpumam, ko nosaka noturīga darba samaksas un nodarbinātības līmeņa palielināšanās un sarūkoša inflācija, vajadzētu veicināt privātā patēriņa pieaugumu. Paredzams, ka mājsaimniecību izdevumi turpinās stimulēt atveseļošanos vidējā termiņā, un to veicinās arī mājsaimniecību uzkrājumu veidošanas tempa kritums salīdzinājumā ar pašreizējo joprojām augsto līmeni. Noturīgajam darba tirgum, kura aktivitāte gan samazinās, un pieņēmumam par pakāpenisku patērētāju konfidences uzlabošanos arī vajadzētu veicināt privātā patēriņa pieaugumu. Paredzams, ka iespēju aplēšu periodā ieguldījumi pakāpeniski nostiprināsies, galvenokārt atspoguļojot agrāk īstenotās monetārās politikas stingrības palielināšanas kavējošās ietekmes izzušanu, kā arī peļņas kāpumu, "Nākamās paaudzes ES" (NPES) programmas līdzekļu izmantošanu un iekšzemes un ārējā pieprasījuma uzlabošanos. Gaidāms, ka pēdējais faktors veicinās arī eksporta pieaugumu, taču tirdzniecības politikas nenoteiktības, kā arī ieilgušo eurozonas konkurētspējas problēmu rezultātā eksporta tirgus daļas turpinās samazināties. Tiek lēsts, ka pašlaik īstenotajai diskrecionāro fiskālā atbalsta pasākumu, kas tika noteikti, reaģējot uz pandēmiju un enerģētikas krīzi, atcelšanai 2025.–2027. gadā joprojām būs neliela negatīva ietekme uz IKP pieaugumu.
3. tabula
Reālā IKP, tirdzniecības un darba tirgus iespēju aplēses
(pārmaiņas salīdzinājumā ar iepriekšējā gada atbilstošo periodu; %, ja nav norādīts citādi; korekcijas procentu punktos)
| 2025. gada marts | Korekcijas salīdzinājumā ar | ||||||
|---|---|---|---|---|---|---|---|---|
2024 | 2025 | 2026 | 2027 | 2024 | 2025 | 2026 | 2027 | |
Reālais IKP | 0.8 | 0.9 | 1.2 | 1.3 | 0.1 | –0.2 | –0.2 | 0.0 |
Privātais patēriņš | 1.0 | 1.4 | 1.2 | 1.2 | 0.1 | 0.1 | –0.1 | 0.0 |
Valdības patēriņš | 2.5 | 1.2 | 1.1 | 1.0 | 0.2 | 0.0 | –0.1 | 0.0 |
Ieguldījumi | –1.8 | 1.2 | 1.7 | 1.4 | –0.1 | 0.0 | –0.5 | –0.2 |
Eksports1) | 0.9 | 0.8 | 2.3 | 2.7 | –0.1 | –0.8 | –0.7 | –0.3 |
Imports1) | 0.1 | 1.9 | 2.6 | 2.8 | 0.0 | –0.4 | –0.5 | –0.1 |
Ieguldījums IKP pieaugumā, ko veido: | ||||||||
Iekšzemes pieprasījums | 0.7 | 1.2 | 1.3 | 1.2 | 0.1 | 0.0 | –0.1 | 0.0 |
Neto eksports | 0.4 | –0.5 | 0.0 | 0.1 | –0.1 | –0.3 | –0.1 | 0.0 |
Krājumu pārmaiņas | –0.3 | 0.1 | 0.0 | 0.0 | 0.0 | –0.1 | 0.0 | 0.0 |
Reāli rīcībā esošie ienākumi | 2.5 | 0.9 | 0.8 | 0.7 | 0.2 | 0.1 | –0.2 | –0.1 |
Mājsaimniecību uzkrājumu rādītājs (% no rīcībā esošajiem ienākumiem) | 15.1 | 14.7 | 14.4 | 14.0 | 0.0 | 0.0 | –0.1 | –0.2 |
Nodarbinātība2) | 0.9 | 0.4 | 0.4 | 0.4 | 0.1 | 0.0 | –0.2 | –0.1 |
Bezdarba līmenis | 6.4 | 6.3 | 6.3 | 6.2 | 0.0 | –0.2 | 0.0 | 0.1 |
Tekošais konts (% no IKP) | 2.6 | 2.0 | 2.2 | 2.3 | –0.1 | –0.6 | –0.5 | –0.6 |
Piezīmes. Reālais IKP un tā komponenti noteikti, izmantojot sezonāli un atbilstoši darbadienu skaitam koriģētus datus. Vēsturiskie dati var atšķirties no jaunākajām Eurostat publikācijām, jo dati tiek publiskoti pēc iespēju aplēšu datu aktualizēšanas pēdējā datuma. Korekcijas aprēķina, izmantojot noapaļotus skaitļus. Datus, t. sk. arī ceturkšņa datus, var lejupielādēt makroekonomisko iespēju aplēšu datubāzē ECB interneta vietnē.
1) Ietver eurozonas iekšējo tirdzniecību.
2) Nodarbinātās personas.
Tiek lēsts, ka agrāk īstenotās monetārās politikas stingrības palielināšanas ietekme uz izaugsmi 2024. gadā sasniegusi augstāko punktu, un gaidāms, ka iespēju aplēšu periodā tā izzudīs. To veicinās notiekošā monetārās politikas procentu likmju pazemināšana. No 2021. gada decembra līdz 2023. gada septembrim īstenoto monetārās politikas pasākumu ietekme turpina izpausties reālajā tautsaimniecībā. Tomēr domājams, ka lielākā daļa no lejupvērstās ietekmes uz izaugsmi jau ir īstenojusies. Pēc monetārās politikas procentu likmju samazināšanas kopš 2024. gada jūnija un pamatojoties uz tirgus gaidām par procentu likmju nākotnes tendencēm iespēju aplēšu pēdējā datu aktualizēšanas datumā (1. ielikums), gaidāms, ka agrāk īstenotās monetārās politikas stingrības palielināšanas ietekme uz tautsaimniecības izaugsmi 2025. gadā izzudīs. Tomēr precīzu ietekmes izzušanas laiku raksturo liela nenoteiktība.
Salīdzinājumā ar speciālistu 2024. gada decembra iespēju aplēsēm reālā IKP pieaugums 2025. un 2026. gadā koriģēts un pazemināts par 0.2 procentu punktiem, bet 2027. gadā pamatā nav mainīts (3. tabula un 2. attēls, b) panelis). Lejupvērstā korekcija 2025. gadā daļēji atspoguļo daudz vājāku ieguldījumu un eksporta rezultātu pārnesto ietekmi 2024. gada 4. ceturksnī, ko nav paredzēts atgūt 2025. gadā. Turklāt, ņemot vērā pastāvīgo politikas nenoteiktību un konkurētspējas problēmas, 2025. un 2026. gadā izaugsmes temps salīdzinājumā ar iepriekšējo ceturksni pārskatīts un samazināts. Neraugoties uz šo korekciju nelielu pārnesto ietekmi uz 2027. gadu, prognozētais pieauguma temps minētajā gadā nav mainīts (1.3 %). Kopumā pieņēmumu pārmaiņām iespēju aplēšu periodā ir tikai neliela ietekme, jo euro kursa krituma un fiskālo pieņēmumu pārmaiņu augšupvērsto ietekmi lielā mērā kompensē vājāks ārējais pieprasījums un pieņēmumi par augstākām enerģijas cenām (sk. 2. sadaļu un 1. ielikumu).
2. attēls
Eurozonas reālais IKP – dalījums galvenajos izdevumu komponentos
a) Speciālistu 2025. gada marta iespēju aplēses | b) Korekcijas salīdzinājumā ar speciālistu 2024. gada decembra iespēju aplēsēm |
|---|---|
(pārmaiņas salīdzinājumā ar iepriekšējā gada atbilstošo periodu; %; devums; procentu punktos) | (procentu punkti un devums procentu punktos) |
 |  |
Piezīmes. Dati ir koriģēti sezonāli un atbilstoši darbadienu skaitam. Vēsturiskie dati var atšķirties no jaunākajām Eurostat publikācijām, jo dati tiek publiskoti pēc iespēju aplēšu datu aktualizēšanas pēdējā datuma. Vertikālā līnija norāda uz iespēju aplēšu perioda sākumu. Korekcijas aprēķina, izmantojot nenoapaļotus skaitļus.
Gaidāmo privātā patēriņa atveseļošanos veicinās stabils darba samaksas pieaugums algu kāpuma un sarūkošas inflācijas apstākļos. Pēc spēcīgiem 2024. gada 3. ceturkšņa rezultātiem privātā patēriņa pieaugums 4. ceturksnī, visticamāk, palēninājies, kas daļēji skaidrojams ar to, ka izzūd īslaicīgie faktori, kas to veicināja vasarā. Tiek uzskatīts, ka mājsaimniecību tēriņi nostiprinājušies, to gada pieauguma tempam 2025.–2027. gadā pieaugot līdz 1.3 % (vidējais 2023. un 2024. gada rādītājs – aptuveni 0.9 %; 3. attēls). Privāto patēriņu veicina reāli rīcībā esošo ienākumu pieaugums, kas skaidrojams galvenokārt ar joprojām spēcīgo darba samaksas kāpumu, lai gan tiek uzskatīts, ka tas kļūs lēnāks, mazinoties reālās darba samaksas izlīdzināšanās ietekmei, kā arī stabili ar darba samaksu nesaistīti ienākumi (īpaši ienākumi no pašnodarbinātības un finanšu un nefinanšu aktīviem). Turklāt privātā patēriņa pieaugumu vajadzētu veicināt mērenam uzkrājumu rādītāja sarukumam salīdzinājumā ar pašreizējo paaugstināto līmeni, atspoguļojot patēriņa izdevumu tendenču pakāpenisku normalizēšanos. Paredzams, ka gaidāmā patērētāju konfidences uzlabošanās, kā arī patēriņu izlīdzinoša uzvedība – t. i., mājsaimniecību tēriņu novēlota reakcija uz pirktspējas pieaugumu, – arī veicinās pakāpenisku uzkrājumu sarukumu. Tomēr gaidāms, ka mājsaimniecību uzkrājumu rādītājs arī turpmāk būs augsts, atspoguļojot joprojām augstās mājsaimniecībām izsniegto kredītu un noguldījumu procentu likmes un ierobežoto kredītu pieejamību. Salīdzinājumā ar 2024. gada decembra iespēju aplēsēm privātā patēriņa pieaugums 2024. un 2025. gadā koriģēts un paaugstināts par 0.1 procentu punktu, atspoguļojot reāli rīcībā esošo ienākumu pagātnes datu spēcīgāku dinamiku. Neraugoties uz nelielu lejupvērstu korekciju 2026. gadā, privātā patēriņa dinamika vidējā termiņā kopumā atbilst 2024. gada decembra iespēju aplēsēm.
3. attēls
Eurozonas reālā privātā patēriņa pieauguma dekompozīcija
(pārmaiņas salīdzinājumā ar iepriekšējā gada atbilstošo periodu; %; devums; procentu punktos)

Piezīmes. Dati ir koriģēti sezonāli un atbilstoši darbadienu skaitam. Mājsaimniecību uzkrājumu rādītāja paaugstināšanās liecina par negatīvu uzkrājumu devumu patēriņa pieaugumā. Vēsturiskie dati var atšķirties no jaunākajām Eurostat publikācijām, jo dati tiek publiskoti pēc iespēju aplēšu datu aktualizēšanas pēdējā datuma. Statistiskās neatbilstības starp nacionālajiem un sektoru kontiem un to atšķirīgajiem publicēšanas laikiem rada nelielas atšķirības starp privātā patēriņa pieauguma rādītājiem un attiecīgajiem devumiem no ienākumiem un (invertētajām) mājsaimniecību uzkrājumu rādītāja pārmaiņām. Vertikālā līnija norāda uz iespēju aplēšu perioda sākumu.
Paredzams, ka īstermiņā ieguldījumi mājokļos vēl nedaudz samazināsies, bet pēc tam pieaugs, finansēšanas nosacījumu stingrībai pakāpeniski mazinoties un mājsaimniecību reālajiem ienākumiem turpinot palielināties. Ieguldījumu mājokļos ilgstošais kritums 2024. gada 4. ceturksnī, visticamāk, turpinājies, un gaidāms, ka īstermiņā tie vēl nedaudz samazināsies. Tas uzskatāmi parāda joprojām vājo pieprasījumu pēc mājokļiem, ko atspoguļo arī turpmāka mājokļu būvatļauju izsniegšanas lejupslīde. Gaidāms, ka ieguldījumi mājokļos atsāksies ar 2025. gada 2. pusgadu, jo hipotēku kredītu procentu likmju pazemināšanās kopš 2023. gada beigām, visticamāk, pozitīvi ietekmēs pieprasījumu pēc mājokļiem, ko, kā uzskata, veicinās arī mājsaimniecību reālo ienākumu turpmāks pieaugums. Paredzams, ka gada izteiksmē pēc būtiskā krituma 2024. gadā un gaidāmā mazāk izteiktā krituma 2025. gadā ieguldījumi mājokļos 2026. gadā pirmo reizi kopš 2022. gada palielināsies un 2027. gadā turpinās pieaugt.
Gaidāms, ka paaugstinātas nenoteiktības apstākļos ieguldījumi uzņēmējdarbībā īstermiņā saruks, taču vēlāk iespēju aplēšu periodā tiem vajadzētu atjaunoties. To veicinās pieprasījuma pakāpeniska uzlabošanās, finansēšanas nosacījumu stingrības mazināšanās un NPES līdzekļu pozitīvā ietekme. Tiek lēsts, ka ieguldījumi uzņēmējdarbībā eurozonā 2024. gadā sarukuši. Gaidāms, ka īstermiņā tie saglabāsies vāji, ņemot vērā pastāvošo nenoteiktību, kas saistīta gan ar iekšzemes politiskajām norisēm, gan plašākām ģeopolitiskajām un tirdzniecības problēmām pasaules līmenī. Ja nenotiks būtiski globālās tirdzniecības pārrāvumi, gaidāms, ka ieguldījumi iespēju aplēšu periodā pakāpeniski atjaunosies, pašreizējai nenoteiktībai izzūdot un pakāpeniski uzlabojoties finansēšanas nosacījumiem, kā arī tāpēc, ka notiekošā NPES līdzekļu izmaksa, kā gaidāms, piesaistīs turpmākus privātos ieguldījumus. Kopumā gaidāms, ka uzņēmējdarbībā veikto ieguldījumu apjoms 2025. un 2026. gadā nedaudz pieaugs, bet 2027. gadā pieaugums kļūs spēcīgāks.
Gaidāms, ka pēc krasajiem kritumiem 2024. gada beigās eurozonas eksporta pieaugumu joprojām bremzēs konkurētspējas problēmas. Jaunākie dati liecina par ilgstoši zemu sniegumu, eurozonas eksportam atpaliekot no globālā pieprasījuma. Iepriekšējo periodu iespēju aplēsēs eurozonas eksports un eksporta tirgus daļas pastāvīgi pārsteidza ar kritumu (4. attēls). Svarīgi atzīmēt, ka netika veiktas līdzīgas lejupvērstas eurozonas ārējā pieprasījuma korekcijas, izgaismojot konkurētspējas jautājumu nozīmi. Gan eurozonas eksports, gan eksporta tirgus daļas 2024. gada 4. ceturksnī samazinājās, un, lai gan šo samazinājumu veicināja svārstīgie Īrijas dati, pēdējā laikā vērojamais vājums atbilst apsekojumu rādītājiem, kas liecina par lēnu eksporta pieaugumu īstermiņā. Paaugstināta tirdzniecības politikas nenoteiktība vēl vairāk pasliktina eurozonas eksporta pieauguma perspektīvas. Tādējādi 2025. gadā paredzama tikai neliela eksporta pieauguma atjaunošanās tempā, kas zemāks par vēsturiski vidējo līmeni. Lai gan vidējā termiņā gaidāms, ka ārējā pieprasījuma atjaunošanās veicinās eurozonas eksporta pieaugumu, perspektīvu joprojām aizēno tādas problēmas kā Ķīnas radītā konkurence, augstās enerģijas izmaksas un pieaugošas konkurētspējas problēmas dažos augsto tehnoloģiju sektoros. Tāpēc tiek uzskatīts, ka eurozonas eksporta pieauguma temps būs zemāks par vēsturiski vidējo. Paredzams, ka arī imports pieaugs lēni – tempā, kas ir nedaudz zemāks par tā ilgtermiņa tendenci. To mazinās eksporta un ieguldījumu apjoma lejupslīde. Kopumā gaidāms, ka neto tirdzniecības devums izaugsmē 2025. gadā būs negatīvs (–0.5 procentu punkti salīdzinājumā ar 2024. gada decembra iespēju aplēsēs ietverto –0.2 procentu punktu devumu) un pārējā iespēju aplēšu periodā devums būs pamatā neitrāls.
4. attēls
Eurozonas eksporta tirgus daļas
(indekss: 2019. gads = 100)
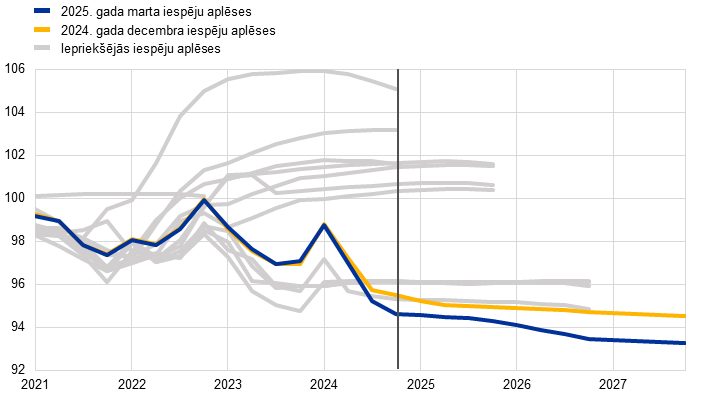
Piezīmes. Vertikālā līnija norāda uz pašreizējā iespēju aplēšu perioda sākumu. Pelēkās līnijas parāda iepriekšējās speciālistu iespēju aplēses kopš 2020. gada marta. Eurozonas eksporta tirgus daļas aprēķina, dalot eksportu uz ārpus eurozonas esošajām valstīm ar eurozonas ārējo pieprasījumu.
Domājams, ka darba tirgus arī turpmāk kopumā būs noturīgs, lai gan tiek uzskatīts, ka nodarbinātības pieaugums salīdzinājumā ar pēdējiem gadiem palēnināsies. Nodarbinātība 2024. gada 4. ceturksnī pieauga nedaudz (kopumā atbilstoši decembra iespēju aplēsēm). Paredzams, ka arī turpmāk iespēju aplēšu periodā tās ceturkšņa pieauguma temps būt tikpat lēns. Gaidāms, ka gada izteiksmē nodarbinātības pieaugums samazināsies no 1.4 % 2023. gadā līdz 0.9 % 2024. gadā un 0.4 % 2025.–2027. gadā (salīdzinājumā ar iepriekšējām iespēju aplēsēm šī prognoze 2026. gadā ir par 0.2 procentu punktiem zemāka un 2027. gadā – par 0.1 procentu punktu zemāka; 5. attēls). Cikliskie faktori, kas pēdējos gados veicinājuši nodarbinātību vairāk nekā parasti (piemēram, darbaspēka uzkrāšana sakarā ar ievērojamu darbaspēka trūkumu, kā arī augsts peļņas pieaugums, vāja reālā darba samaksa un stabils darbaspēka pieaugums), pakāpeniski izzudīs. Salīdzinājumā ar iepriekšējām iespēju aplēsēm tagad tiek vērtēts, ka dažu šo veicinošo faktoru izzušana kļūst izteiktāka. Tāpēc paredzams, ka nodarbinātības pieaugums attiecībā pret IKP pieaugumu būs nedaudz mazāks, nekā tika pieņemts iepriekšējās iespēju aplēsēs.
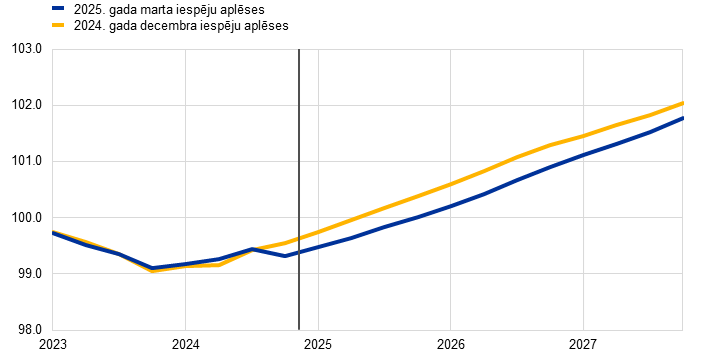
5. attēls
(indekss: 2022. gada 1. cet. = 100)

Piezīme. Vertikālā līnija norāda uz iespēju aplēšu perioda sākumu.
Gaidāms, ka darba ražīguma pieaugums 2025. un 2026. gadā nostiprināsies lēnākā tempā, nekā prognozēts iepriekšējās iespēju aplēsēs. Darba ražīguma pieaugums (uz vienu nodarbināto) 2024. gada 4. ceturksnī bija pārsteidzoši zems un gaidāms, ka 2025. gadā tas atjaunosies lēnāk, nekā tika paredzēts iepriekšējās iespēju aplēsēs. Tiek uzskatīts, ka tas pieaugs no –0.1 % 2024. gadā līdz 0.4 % 2025. gadā un 0.8–0.9 % 2026. un 2027. gadā. To var salīdzināt ar darba ražīguma (uz vienu nodarbināto) vēsturisko vidējo gada pieauguma tempu laikposmā no 2000.–2019. gadam (0.6 %). Tagad paredzams, ka pēdējā laikā vērojamie cikliskie faktori, kas izraisīja pastiprinātu darbaspēka uzkrāšanu, vāju reālo darba samaksu un stabilu darbaspēka pieaugumu, izzudīs nedaudz straujāk, nekā prognozēts iepriekšējās iespēju aplēsēs (6. attēls). Tāpēc tagad tiek pieņemts, ka darba ražīguma pieaugums iespēju aplēšu perioda beigās būs spēcīgāks. Tāpat kā iepriekšējās iespēju aplēsēs tiek uzskatīts, ka atveseļošanās tempu 2025. un 2026. gadā ierobežos strukturāli faktori, piemēram, ekonomiskās aktivitātes pakāpeniskā pārvirzīšanās uz pakalpojumu nozari, izmaksas, ko rada pāreja uz videi nekaitīgāku ekonomiku, ilglaicīgāka enerģijas cenu šoka nelabvēlīgā ietekme, lēnāka, nekā gaidīts, ļoti inovatīvu MI tehnoloģiju ieviešana un demogrāfiskās pārmaiņas.
6. attēls
Darba ražīgums uz vienu nodarbināto
(indekss: 2022. gada 1. cet. = 100)
Piezīme. Vertikālā līnija norāda uz iespēju aplēšu perioda sākumu.
Gaidāms, ka bezdarba līmenis iespēju aplēšu periodā saglabāsies samērā stabils un zems (7. attēls). Bezdarba līmenis 2024. gada 4. ceturksnī bija par 0.2 procentu punktiem zemāks, nekā prognozēts iepriekšējās iespēju aplēsēs. Gaidāms, ka 2025. gadā tas nedaudz palielināsies. Pēc tam sakarā ar notiekošo tautsaimniecības atveseļošanos, kas gan būs lēna, bezdarba līmenis ar 2026. gada 2. ceturksni atkal varētu samazināties, 2027. gadā sasniedzot 6.2 %. Ņemot vērā jaunākos datus, bezdarba līmenis 2025. gadā koriģēts un pazemināts par 0.2 procentu punktiem, savukārt 2027. gadā paaugstināts par 0.1 procentu punktu sakarā ar gaidāmu lēnāku nodarbinātības pieaugumu atbilstoši izaugsmes perspektīvas korekcijām. Tāpat kā 2024. gada decembra iespēju aplēsēs paredzams, ka darbaspēka pieauguma temps samazināsies un būs daudz lēnāks nekā pēdējos gados.
7. attēls
(% no darbaspēka)
Piezīme. Vertikālā līnija norāda uz iespēju aplēšu perioda sākumu.
4. Fiskālā perspektīva
Tiek lēsts, ka eurozonas fiskālā nostāja 2024. gadā kļuvusi būtiski stingrāka.[4] Paredzams, ka turpmāk 2025. gadā tā kļūs tikai nedaudz stingrāka, 2026. gadā būs neitrāla un 2027. gadā atkal kļūs stingrāka nedaudz lielākā mērā (4. tabula). Fiskālās nostājas stingrības palielināšanās apmēru 2024. gadā noteica būtiski ar diskrecionārajiem pasākumiem nesaistīti faktori, kā arī vairuma enerģijas un inflācijas atbalsta pasākumu atcelšana. Ar diskrecionārajiem pasākumiem nesaistītie faktori galvenokārt atspoguļoja spēcīgo ieņēmumu dinamiku dažās valstīs, ko galvenokārt noteica struktūras efekti (nodokļu bāzes straujāks pieaugums par nominālo IKP) un citi faktori, kas novērtēti kā īslaicīgi. Attiecībā uz 2025. gadu diskrecionārie fiskālās politikas pasākumi, kas atspoguļo eurozonas valstu valdību budžeta plānus (no kuriem daži joprojām nav pilnībā apstiprināti valstu parlamentos), norāda uz stingrības palielināšanos, galvenokārt atspoguļojot nodokļu un sociālās nodrošināšanas iemaksu pieaugumu. Stingrības palielināšanos lielā mērā kompensē valsts investīciju kāpums un lielāki fiskālie pārvedumi, kā arī fiskālās nostājas stingrības mazināšanās ar diskrecionārajiem pasākumiem nesaistīto faktoru dēļ.[5] Paredzams, ka 2026. gadā fiskālā nostāja kopumā būs neitrāla. Samērā spēcīgā fiskālās nostājas un diskrecionāro pasākumu stingrības palielināšanās 2027. gadā galvenokārt atspoguļo pieņēmumu, ka saistībā ar NPES subsīdiju finansējuma pārtraukšanu saruks valsts investīcijas un fiskālie pārvedumi.[6] Kumulatīvā fiskālā nostāja 2020.–2027. gadā kopumā joprojām ir stimulējoša, atspoguļojot to, ka lielais fiskālais atbalsts, kas sniegts kopš pandēmijas, pārtraukts tikai daļēji.
4. tabula
(% no IKP; korekcijas procentu punktos)
| 2025. gada marts | Korekcijas salīdzinājumā ar | ||||||
|---|---|---|---|---|---|---|---|---|
2024 | 2025 | 2026 | 2027 | 2024 | 2025 | 2026 | 2027 | |
Fiskālā nostāja1) | 0.9 | 0.2 | 0.0 | 0.5 | 0.0 | 0.1 | –0.1 | –0.1 |
Valdības budžeta bilance | –3.2 | –3.2 | –3.3 | –3.3 | 0.0 | –0.1 | –0.3 | –0.4 |
Strukturālā budžeta bilance2) | –3.0 | –3.0 | –3.1 | –3.1 | 0.1 | 0.0 | –0.1 | –0.2 |
Valdības bruto parāds | 87.7 | 88.4 | 89.4 | 89.8 | –0.1 | 0.1 | 0.7 | 1.2 |
1) Fiskālo nostāju mēra kā pārmaiņas cikliski koriģētajā sākotnējā bilancē (neietverot valdības palīdzību finanšu sektoram). Skaitļi arī koriģēti, atspoguļojot "Nākamās paaudzes ES" (NPES) programmas subsīdijas, kuras neietekmē tautsaimniecību ieņēmumu pusē. Negatīvs (pozitīvs) rādītājs nozīmē fiskālās nostājas stingrības mazināšanos (palielināšanos).
2) Strukturālo bilanci aprēķina, no valdības bilances atņemot ekonomiskās attīstības ciklisko svārstību ietekmi un pasākumus, kas klasificēti kā pagaidu pasākumi saskaņā ar Eiropas Centrālo banku sistēmas definīciju.
Salīdzinājumā ar 2024. gada decembra iespēju aplēsēm diskrecionārās fiskālās politikas pasākumi norāda uz nelielu fiskālās nostājas stingrības mazināšanos. To galvenokārt nosaka lielāks valdības patēriņš, īpaši 2024. gadā, zemāki tiešie un netiešie nodokļi 2025. gadā un lielāki fiskālie pārvedumi 2026. un 2027. gadā. Politikas pasākumu korekcijas iespēju aplēšu periodā pamatā nosaka kumulatīvā izteiksmē nedaudz mazāk stingru fiskālo nostāju.
Salīdzinājumā ar decembra iespēju aplēsēm eurozonas fiskālā perspektīva pasliktinājusies, un paredzams, ka budžeta bilance stabilizēsies tikai zem robežvērtības (–3 % no IKP), un gaidāms parāda rādītāja pieaugums (4. tabula). Paredzams, ka eurozonas budžeta bilance iespēju aplēšu periodā pamatā nemainīsies (2027. gadā – –3.3 % no IKP). Šī tendence galvenokārt atbilst cikliski koriģētajai sākotnējai bilancei, kas, kā tiek uzskatīts, būtiski uzlabojusies 2024. gadā un turpmāk uzlabosies tikai ļoti nedaudz. Paredzams, ka cikliskais komponents 2025. gadā turpinās pasliktināties un 2026. un 2027. gadā kopumā nemainīsies. Paredzams, ka procentu maksājumi iespēju aplēšu periodā pakāpeniski palielināsies. Salīdzinājumā ar decembra iespēju aplēsēm budžeta bilance 2025.–2027. gadā koriģēta un samazināta. Tas atspoguļo kumulatīvo fiskālās nostājas stingrības mazināšanos, kas izpaužas diskrecionārajos pasākumos, un makroekonomiskās perspektīvas pasliktināšanos. Tiek uzskatīts, ka eurozonas parāda attiecības pret IKP tendence ir augoša, jo nepārtrauktais sākotnējais budžeta deficīts un pozitīvās deficīta-parāda korekcijas ar uzviju kompensē labvēlīgo procentu likmju un izaugsmes tempa starpību. Salīdzinājumā ar decembra iespēju aplēsēm parāda rādītājs koriģēts un paaugstināts galvenokārt sakarā ar lielāku sākotnējo budžeta deficītu un procentu likmju un izaugsmes tempa starpību. Eurozonas fiskālās iespēju aplēses joprojām saistītas ar lielu nenoteiktību. To nosaka vairāki avoti, t. sk. ilgstošā ģeopolitiskā spriedze un pasākumi, kurus eurozonas valdības varētu veikt, reaģējot uz to, īpaši saistībā ar lielākiem aizsardzības izdevumiem.
5. Cenas un izmaksas
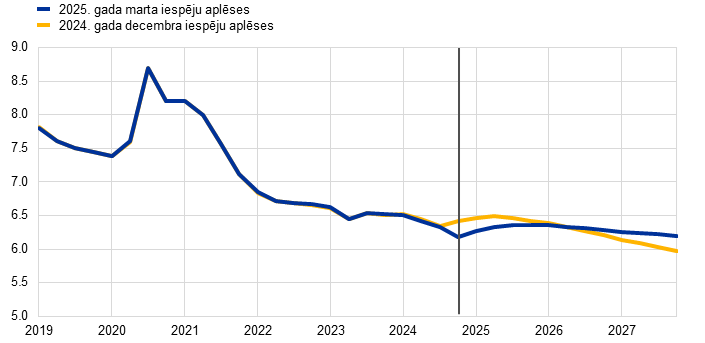
Gaidāms, ka īstermiņā kopējā inflācija samazināsies tikai nedaudz (līdz vidēji 2.3 % 2025. gadā), bet pēc tam 2026. gadā saruks līdz 1.9 % un 2027. gadā – līdz 2.0 % (8. attēls un 9. attēls). Gaidāms, ka kopējā inflācija 2025. gadā samazināsies tikai nedaudz. Tas galvenokārt skaidrojams ar augstāku pārtikas cenu inflāciju un augšupvērsto bāzes efektu izpausmi enerģijas cenās, lielā mērā kompensējot SPCIX inflācijas krituma lejupvērsto ietekmi. Mazinoties bāzes efektu ietekmei uz enerģijas cenu inflāciju, gaidāms, ka kopējā inflācija 2026. gada sākumā samazināsies līdz 2.0 % un līdz iespēju aplēšu perioda beigām saglabāsies 2 % inflācijas mērķa līmenī vai nedaudz zem tā. 2027. gadā prognozētais 2.0 % inflācijas līmenis ietver enerģijas cenu inflācijas īslaicīgu augšupvērstu ietekmi saistībā ar jaunas emisijas kvotu tirdzniecības sistēmas (ETS2) ieviešanu. Gaidāms, ka SPCIX inflācija visā iespēju aplēšu periodā samazināsies, līdz 2027. gadam sasniedzot 1.9 %.
8. attēls
(pārmaiņas salīdzinājumā ar iepriekšējā gada atbilstošo periodu; %)

Piezīmes. Vertikālā līnija norāda uz pašreizējā iespēju aplēšu perioda sākumu. Ar galveno iespēju aplēšu atainošanai izmantotajiem diapazoniem novērtēta nenoteiktības pakāpe. Diapazoni ir simetriski. Tie balstās uz agrākām aplēšu kļūdām, veicot korekcijas, kas atspoguļo izņēmumus. Intervāli (no tumšākā līdz gaišākajam) atspoguļo 30 %, 60 % un 90 % varbūtību, ka SPCI inflācija iekļausies attiecīgajos intervālos. Sīkāku informāciju sk. ECB speciālistu 2023. gada marta makroekonomisko iespēju aplēšu eurozonai ielikumā "Ar aplēsēm saistītās nenoteiktības attēlojums".
9. attēls
Eurozonas SPCI inflācija – dalījums galvenajos komponentos
(pārmaiņas salīdzinājumā ar iepriekšējā gada atbilstošo periodu; %; procentu punktos)

Piezīme. Vertikālā līnija norāda uz pašreizējā iespēju aplēšu perioda sākumu.
Paredzams, ka pēc divu gadu negatīvas izaugsmes enerģijas inflācija visā iespēju aplēšu periodā saglabāsies pozitīva. Gaidāms, ka pēc bāzes efektu izraisīta kāpuma 2025. gada 2. pusgadā enerģijas cenu inflācija saglabāsies neliela. Tiek uzskatīts, ka pieauguma temps 2026. un 2027. gadā būs pozitīvs, bet zemāks par vēsturiski vidējo līmeni, neraugoties uz būtisku lejupvērstu bāzes efektu 2026. gada 1. ceturksnī un pieņēmumu par enerģijas izejvielu cenu kritumu (10. attēls, a) panelis). Palielinājums no 0.1 % 2026. gadā līdz 2.3 % 2027. gadā lielā mērā atspoguļo augšupvērsto pagaidu ietekmi, ko rada ES "Gatavi mērķrādītājam 55 %" tiesību aktu kopuma īstenošana, jo īpaši ETS2 ēku apkurei un transporta degvielai.[7]
Gaidāms, ka pārtikas cenu inflācija 2025. gadā īslaicīgi palielināsies, bet pēc tam saruks, un tās virzība kopumā būs horizontāla (10. attēls, b) panelis). Gaidāms, ka pēdējos mēnešos vērojamo pārtikas cenu inflācijas kritumu nomainīs kāpums un 2025. gada 3. ceturksnī tā atgriezīsies aptuveni 3.0 % līmenī. Vismaz sākotnēji to noteiks neapstrādātās pārtikas cenu inflācijas augšupvērstais bāzes efekts, pēc tam atspoguļojot pieņēmumu par stabilu preču cenu kāpumu. Paredzams, ka pēc tam līdz 2027. gadam pārtikas cenu inflācija sarūkošā izmaksu spiediena dēļ saruks līdz vidēji 2.2 %, kas ir būtiski zem tās ilgāka termiņa vidējā līmeņa.
10. attēls
SPCI enerģijas un pārtikas cenu inflācijas perspektīva
a) SPCI enerģijas cenu inflācija
(pārmaiņas salīdzinājumā ar iepriekšējā gada atbilstošo periodu; %)

b) SPCI pārtikas cenu inflācija
(pārmaiņas salīdzinājumā ar iepriekšējā gada atbilstošo periodu; %)

Piezīme. Vertikālā līnija norāda uz pašreizējā iespēju aplēšu perioda sākumu.
5. tabula
Cenu un izmaksu attīstība eurozonā
(pārmaiņas salīdzinājumā ar iepriekšējā gada atbilstošo periodu; %; korekcijas procentu punktos)
| 2025. gada marts | Korekcijas salīdzinājumā ar | ||||||
|---|---|---|---|---|---|---|---|---|
2024 | 2025 | 2026 | 2027 | 2024 | 2025 | 2026 | 2027 | |
SPCI | 2.4 | 2.3 | 1.9 | 2.0 | 0.0 | 0.2 | 0.0 | –0.1 |
SPCI (neietverot enerģijas cenas) | 2.9 | 2.4 | 2.2 | 2.0 | 0.0 | –0.1 | 0.2 | 0.0 |
SPCI (neietverot enerģijas un pārtikas cenas) | 2.8 | 2.2 | 2.0 | 1.9 | –0.1 | –0.1 | 0.1 | 0.0 |
SPCI (neietverot enerģijas un pārtikas cenas un netiešo nodokļu pārmaiņas) | 2.8 | 2.2 | 2.0 | 1.9 | 0.0 | –0.1 | 0.1 | 0.0 |
SPCI (enerģijas cenas) | –2.2 | 1.5 | 0.1 | 2.3 | 0.1 | 2.6 | –0.4 | –0.5 |
SPCI (pārtikas cenas) | 2.9 | 2.8 | 2.6 | 2.2 | –0.1 | –0.2 | 0.2 | 0.0 |
IKP deflators | 2.9 | 2.5 | 2.0 | 2.0 | 0.0 | 0.1 | –0.1 | –0.1 |
Importa deflators | –0.7 | 2.4 | 1.7 | 1.5 | –0.1 | 0.8 | –0.1 | –0.2 |
Atlīdzība vienam nodarbinātajam | 4.6 | 3.4 | 2.8 | 2.6 | 0.0 | 0.1 | –0.1 | –0.2 |
Darba ražīgums uz vienu nodarbināto | –0.1 | 0.4 | 0.8 | 0.9 | 0.0 | –0.4 | –0.1 | 0.1 |
Vienības darbaspēka izmaksas | 4.7 | 3.0 | 2.0 | 1.7 | 0.0 | 0.4 | 0.0 | –0.3 |
Vienības peļņa¹⁾ | –1.7 | 1.2 | 1.9 | 2.5 | –0.8 | –0.8 | –0.1 | 0.1 |
Piezīmes. Korekcijas aprēķina, izmantojot noapaļotus skaitļus. IKP un importa deflatori, vienības darbaspēka izmaksas, atlīdzība vienam nodarbinātajam un darba ražīgums noteikti, izmantojot sezonāli un atbilstoši darbadienu skaitam koriģētus datus. Vēsturiskie dati var atšķirties no jaunākajām Eurostat publikācijām, jo dati tiek publiskoti pēc iespēju aplēšu datu aktualizēšanas pēdējā datuma. Datus, t. sk. arī ceturkšņa datus, var lejupielādēt makroekonomisko iespēju aplēšu datubāzē ECB interneta vietnē.
1) Vienības peļņa definēta kā bruto darbības ieņēmumi un dažādi ienākumi (kas koriģēti, lai atspoguļotu pašnodarbināto personu ienākumus) uz vienu reālā IKP vienību.
Gaidāms, ka SPCIX inflācija samazināsies no 2.8 % 2024. gadā līdz 1.9 % 2027. gadā. To galvenokārt noteiks mērens pakalpojumu cenu inflācijas kritums, turpinot izzust agrāko lielo šoku ietekmei. SPCIX inflācija kopš 2024. gada sākuma bijusi samērā nemainīga, bet gaidāms, ka, sākot ar 2025. gada 1. ceturksni, tā samazināsies (11. attēls). Paredzamais SPCIX inflācijas kritums ar 2025. gadu skaidrojams ar pakalpojumu cenu inflācijas pakāpenisku samazināšanos, beidzoties novēlotām korekcijām atbilstoši vispārējām cenu tendencēm un mazinoties darbaspēka izmaksu spiedienam. Turklāt ar SPCIX inflāciju saistītais dezinflācijas process atspoguļo atlikušo lejupvērsto ietekmi, ko rada agrāko enerģijas cenu pārmaiņu netiešo efektu mazināšanās un agrāk īstenotās monetārās politikas stingrības palielināšanas lejupvērstās ietekmes turpmākā transmisija.
11. attēls
Eurozonas SPCI inflācija (neietverot enerģijas un pārtikas cenas)
(pārmaiņas salīdzinājumā ar iepriekšējā gada atbilstošo periodu; %)

Piezīmes. Vertikālā līnija norāda uz pašreizējā iespēju aplēšu perioda sākumu. Ar galveno iespēju aplēšu atainošanai izmantotajiem diapazoniem novērtēta nenoteiktības pakāpe. Diapazoni ir simetriski. Tie balstās uz agrākām aplēšu kļūdām, veicot korekcijas, kas atspoguļo izņēmumus. Intervāli (no tumšākā līdz gaišākajam) atspoguļo 30 %, 60 % un 90 % varbūtību, ka SPCIX inflācija iekļausies attiecīgajos intervālos. Sīkāku informāciju sk. ECB speciālistu 2023. gada marta makroekonomisko iespēju aplēšu eurozonai ielikumā "Ar aplēsēm saistītās nenoteiktības attēlojums".
Salīdzinājumā ar 2024. gada decembra iespēju aplēsēm kopējās SPCI inflācijas perspektīva 2025. gadam paaugstināta par 0.2 procentu punktiem, 2026. gadam nav koriģēta un 2027. gadam pazemināta par 0.1 procentu punktu (12. attēls). Augšupvērsto korekciju 2025. gadā galvenokārt nosaka enerģijas cenu inflācija sakarā ar spēcīgākiem datiem, nekā gaidīts, un pieņēmumu par naftas, gāzes un elektroenerģijas cenām augšupvērsto korekciju (sk. 1. ielikumu). To daļēji kompensē nelielas lejupvērstas SPCIX un pārtikas komponentu korekcijas, kas lielā mērā saistītas ar jaunākajiem datiem. SPCIX inflācija 2026. gadā koriģēta un nedaudz palielināta (par 0.1 procentu punktu). Tam pamatā ir augšupvērstā ietekme, ko rada pieņēmumu pārmaiņas, konkrētāk, zemāks euro kurss, un vienības darbaspēka izmaksu augšupvērsta korekcija 2025. gadā, ko tikai daļēji kompensē vājākas pieprasījuma perspektīvas negatīvā ietekme. Attiecībā uz 2027. gadu abas šīs ietekmes ir vienmērīgāk līdzsvarotas, tāpēc SPCIX inflācija neto izteiksmē nav koriģēta. Enerģijas cenu inflācija 2026. un 2027. gadā koriģēta un nedaudz pazemināta sakarā ar pieņēmumu par krasāku naftas un gāzes cenu kritumu, nekā paredzēts decembra iespēju aplēsēs. Lai gan enerģijas cenu inflācijas korekcijas kompensē SPCIX inflācijas augšupvērstā korekcija 2026. gadā, to rezultātā 2027. gadā veikta neliela lejupvērsta kopējās inflācijas korekcija.
12. attēls
Inflācijas iespēju aplēses korekcijas salīdzinājumā ar 2024. gada decembra iespēju aplēsēm
(procentu punktos)
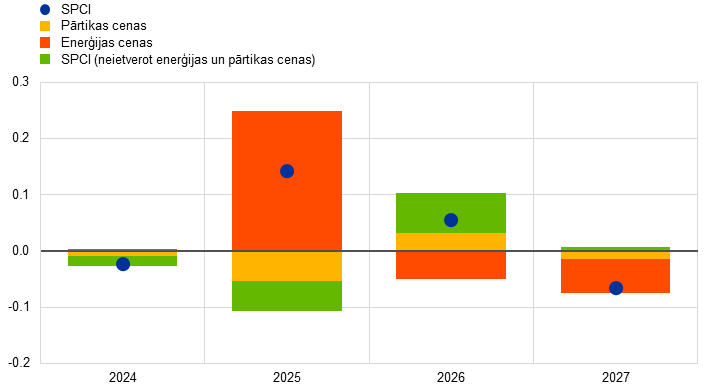
Piezīme. Korekcijas veiktas, izmantojot nenoapaļotus skaitļus.
Paredzams, ka nominālās darba samaksas pieaugums sākotnēji saglabāsies paaugstināts, bet tad pakāpeniski palēnināsies, cita starpā atspoguļojot faktu, ka reālā darba samaksa būs sasniegusi līmeni, kāds bija pirms inflācijas kāpuma. Tiek lēsts, ka atlīdzības vienam nodarbinātajam pieaugums 2024. gada 4. ceturksnī palēninājies līdz 4.3 % (par 0.1 procentu punktu virs decembra iespēju aplēsēs paredzētā līmeņa). Paredzams, ka darba samaksas pieaugums turpinās samazināties (no vidēji 3.4 % 2025. gadā līdz 2.6 % 2027. gadā; 13. attēls). Šis samazinājums galvenokārt atspoguļo gaidāmo vienošanās ceļā noteiktās darba samaksas pieauguma mazināšanos un nelielu lēnāka minimālās algas pieauguma ietekmi, un atbilst prognozei, ka darba samaksas īpatsvars lēnām atgriezīsies ilgāka termiņa vidējā rādītāja līmenī.[8] Tiek lēsts, ka reālā darba samaksa 2024. gada 3. ceturksnī atgriezusies 2021. gada sākuma līmenī, kā paredzēts 2024. gada decembra iespēju aplēsēs. Lai gan tas nozīmē mazāku inflācijas kompensācijas spiedienu, darba tirgus apstākļi joprojām ir saspringti, un tas daļēji izskaidro, kāpēc vidējās darba samaksas pieaugums iespēju aplēšu periodā joprojām ir nedaudz paaugstināts salīdzinājumā ar vēsturisko līmeni (2.5 % 1999.–2024. gadā). Salīdzinājumā ar 2024. gada decembra iespēju aplēsēm atlīdzības vienam nodarbinātajam pieaugums koriģēts un paaugstināts par 0.1 procentu punktu 2025. gadā, bet pazemināts par 0.1 procentu punktu 2026. gadā un par 0.2 procentu punktiem 2027. gadā.
13. attēls
Atlīdzība vienam nodarbinātajam
(gada procentu punkti)

Piezīme. Vertikālā līnija norāda uz pašreizējā iespēju aplēšu perioda sākumu.
Paredzams, ka vienības darbaspēka izmaksu pieaugums 2026. un 2027. gadā palēnināsies. To veicinās darba samaksas pieauguma mazināšanās un darba ražīguma kāpums. Tiek lēsts, ka vienības darbaspēka izmaksu pieaugums 2024. gada 4. ceturksnī bija 4.1 %, un gaidāms, ka līdz 2027. gadam tas samazināsies līdz vidēji 1.7 % atbilstoši vēsturiskajam vidējam rādītājam. Salīdzinājumā ar 2024. gada decembra iespēju aplēsēm vienības darbaspēka izmaksu pieaugums koriģēts un 2025. gadā paaugstināts par 0.4 procentu punktiem galvenokārt sakarā ar lēnāku darba ražīguma kāpumu, bet 2027. gadā – par 0.3 procentu punktiem galvenokārt sakarā ar atlīdzības vienam nodarbinātajam kāpuma lejupvērstām korekcijām.
Kopumā paredzams, ka iekšzemes cenu spiediens, ko mēra ar IKP deflatora pieaugumu, turpinās samazināties, neraugoties uz peļņas maržu kāpuma tempa pieaugumu iespēju aplēšu perioda otrajā pusē atbilstoši tautsaimniecības atveseļošanās procesam (14. attēls). IKP deflatora gada pieauguma temps 2024. gadā strauji samazinājās, un tiek lēsts, ka tas ir vidēji 2.9 % gadā (2023. gadā – 5.9 %). To izraisīja darbaspēka izmaksu devuma samazinājums un vienības peļņas negatīvais devums. Tomēr paredzams, ka IKP deflatora pieaugums, sākot ar šo gadu, samazināsies pakāpeniskāk, 2026. un 2027. gadā sasniedzot vidēji 2.0 %. Tā kā vienības darbaspēka izmaksu pieaugums palēninās un citu ražošanas izmaksu dinamika joprojām ir ierobežota, gaidāms, ka, sākot ar 2025. gadu, vienības peļņas pieaugums nedaudz atjaunosies. To veicinās tautsaimniecības atveseļošanās, produktivitātes pieauguma nostiprināšanās un īslaicīgais kāpums 2027. gadā saistībā ar ETS2 statistisko apstrādi.[9] Salīdzinājumā ar 2024. gada decembra iespēju aplēsēm IKP deflatora pieaugums 2026. un 2027. gadā koriģēts un mazliet pazemināts. Vienības peļņas pieaugums koriģēts un 2025. gadā samazināts, bet 2026. gadā – nedaudz palielināts, lielā mērā kompensējot attiecīgās augšupvērstās un lejupvērstās vienības darbaspēka izmaksu pieauguma korekcijas.
14. attēls
IKP deflators un tā komponenti
(pārmaiņas salīdzinājumā ar iepriekšējā gada atbilstošo periodu; %; devums; procentu punktos)
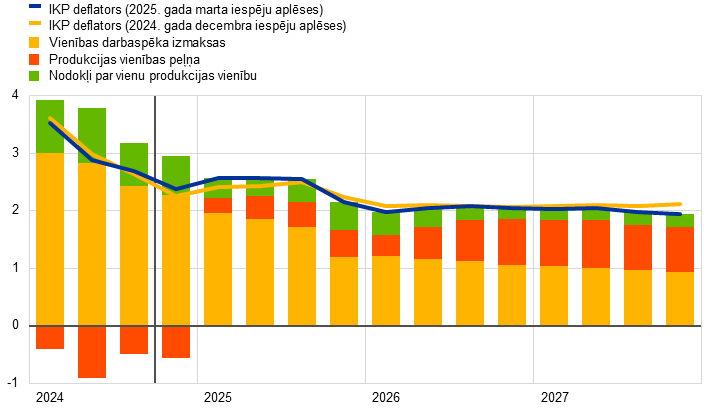
Piezīme. Vertikālā līnija norāda uz pašreizējā iespēju aplēšu perioda sākumu.
Gaidāms, ka importa cenu inflācija 2025. gadā strauji pieaugs, bet iespēju aplēšu perioda beigās atkal samazināsies. Gaidāms, ka importa deflatora pieaugums kļūs straujāks (no –0.7 % 2024. gadā līdz 2.4 % 2025. gadā). Pēc tam tas palēnināsies līdz 1.5 % 2027. gadā. Importa cenu inflācijas korekcijas (t. i., būtiska augšupvērsta korekcija 2025. gadā un neliela lejupvērsta korekcija 2026. un 2027. gadā) atbilst tehniskajos pieņēmumos ietvertajām enerģijas izejvielu cenu pārmaiņām un euro kursa kritumam.[10]
6. Jutīguma analīze
Alternatīvas enerģijas cenu tendences
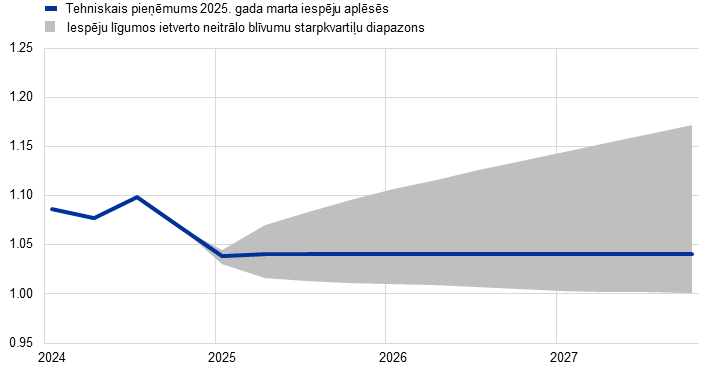
Enerģijas izejvielu cenu dinamika nākotnē ir nenoteikta, un alternatīvas naftas un gāzes izejvielu cenu tendences joprojām būtiski ietekmētu perspektīvu, īpaši attiecībā uz inflāciju. Lai gan speciālistu iespēju aplēšu pamatā ir 1. ielikumā aplūkotie tehniskie pieņēmumi, šajā jutīguma analīzē izmantotas alternatīvas lejupvērstas un augšupvērstas tendences, kas iegūtas, pamatojoties uz iespēju līgumos ietverto naftas un gāzes cenu neitrālo blīvumu 25. un 75. procentili.[11] Alternatīvās naftas cenu tendences simetriski sadalītas ap pamataplēsi. Augšupvērstos riskus saistībā ar stingrākām ASV sankcijām pret Krievijas vai Irānas naftas eksportu līdzsvaro lejupvērsti riski saistībā ar tirdzniecības domstarpībām vai ievērojamu OPEC+ jaudas pārpalikumu. Turpretī gāzes cenu sadalījums norāda uz augšupvērstiem riskiem saistībā ar tehniskajiem pieņēmumiem (15. attēls), visticamāk, atspoguļojot piedāvājuma nenoteiktību. Šī nenoteiktība saistīta ar globālā sašķidrinātās dabasgāzes (LNG) tirgus traucējumiem, t. sk. Krievijas LNG eksporta samazināšanos sakarā ar ASV sankcijām vai turpmāku plānoto LNG projektu kavēšanos, kā arī ar riskiem, kas rodas Eiropas tirgū, piemēram, grūtībām sasniegt gāzes uzglabāšanas regulatīvos 2025. gada novembra mērķus. Pastāv arī lejupvērsti riski, īpaši, ja tiktu sasniegts ievērojams progress Krievijas kara pret Ukrainu izbeigšanā. Tiek apsvērts arī konstantu cenu pieņēmums attiecībā uz naftas un gāzes cenām. Katrā gadījumā tiek aprēķināts sintētisks enerģijas cenu indekss (naftas un gāzes cenu tendenču vidējais svērtais rādītājs) un ietekme novērtēta, izmantojot ECB un Eurosistēmas speciālistu makroekonomiskos modeļus. Rezultāti atspoguļoti 6. tabulā. Tie kopumā liecina par nedaudz spēcīgākiem augšupvērstiem, nevis lejupvērstiem inflācijas riskiem un ierobežotākiem IKP pieauguma riskiem.
15. attēls
Alternatīvas enerģijas cenu pieņēmumu tendences
a) Pieņēmums par naftas cenām
(ASV dolāros par barelu)

b) Pieņēmums par gāzes cenām
(euro par MWh)
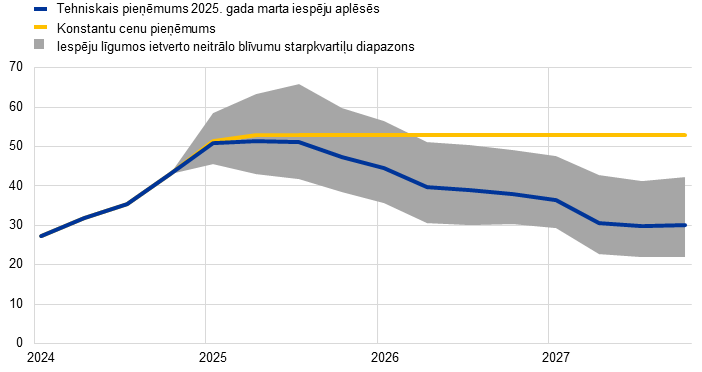
Avoti: Morningstar un ECB aprēķini.
Piezīme. Iespēju līgumos ietvertie naftas un gāzes cenu blīvumi iegūti no tirgū kotētajām cenām 2025. gada 6. februārī – Brent jēlnaftas iespēju līgumu cenām ICE biržā un dabasgāzes nākotnes līgumu (ar fiksētiem ceturkšņa līguma beigu termiņiem) cenām Nīderlandes biržā.
6. tabula
Alternatīvas enerģijas cenu attīstības tendences un to ietekme uz reālā IKP pieaugumu un SPCI inflāciju
1. tendence: 25. procentile | 2. tendence: 75. procentile | 3. tendence: konstantas cenas | |||||||
|---|---|---|---|---|---|---|---|---|---|
2025 | 2026 | 2027 | 2025 | 2026 | 2027 | 2025 | 2026 | 2027 | |
(novirze no pamataplēses līmeņa; %) | |||||||||
Naftas cenas | –10.7 | –16.4 | –18.8 | 10.2 | 16.3 | 21.3 | 3.6 | 9.8 | 12.3 |
Gāzes cenas | –16.0 | –21.6 | –24.6 | 23.1 | 28.3 | 37.0 | 4.4 | 30.9 | 66.4 |
Sintētiskais enerģijas cenu indekss | –14.4 | –18.0 | –21.2 | 19.2 | 24.7 | 29.9 | 3.9 | 18.2 | 31.2 |
(novirzes no pamataplēses pieauguma tempa; procentu punktos) | |||||||||
Reālā IKP pieaugums | 0.0 | 0.1 | 0.1 | 0.0 | –0.2 | –0.1 | 0.0 | –0.1 | –0.1 |
SPCI inflācija | –0.5 | –0.6 | –0.3 | 0.6 | 0.7 | 0.5 | 0.2 | 0.6 | 0.6 |
Piezīmes. Šajā jutīguma analīzē izmantots sintētisks enerģijas cenu indekss, apvienojot biržā tirgoto naftas un gāzes nākotnes līgumu cenas. 25. un 75. procentile attiecas uz naftas un gāzes cenu neitrālajiem blīvumiem 2025. gada 6. februārī, kas iegūti no iespēju līgumiem. Konstantā naftas un gāzes cena atbilst vērtībai tajā pašā datumā. Makroekonomiskā ietekme norādīta kā vairāku ECB un Eurosistēmas speciālistu makroekonomisko modeļu vidējais rezultāts.
Alternatīvas valūtas kursa tendences
Šajā jutīguma analīzē novērtēta valūtas kursa alternatīvo tendenču ietekme uz pamataplēsēm, kas kopumā norāda uz lejupvērstiem izaugsmes un inflācijas riskiem. Pamataplēsēs tehniskie pieņēmumi par valūtu kursiem tiek saglabāti nemainīgi visā iespēju aplēšu periodā. Alternatīvās lejupvērstās un augšupvērstās tendences, kas iegūtas, pamatojoties uz iespēju līgumos ietverto euro kursa attiecībā pret ASV dolāru neitrālo blīvumu 25. un 75. procentili 2025. gada 6. februārī, liecina par euro kursa kāpuma riskiem salīdzinājumā ar pamataplēsi (16. attēls). Šādu alternatīvu tendenču ietekme vērtēta, izmantojot ECB un Eurosistēmas speciālistu makroekonomiskos modeļus. 7. tabulā parādīta vidējā ietekme uz produkcijas izlaides pieaugumu un inflāciju šajos modeļos.
16. attēls
Euro kursa attiecībā pret ASV dolāru alternatīvās tendences
Avoti: Bloomberg un ECB speciālistu aprēķini.
Piezīmes. Pieaugums nozīmē euro kursa kāpumu. 25. un 75. procentile attiecas uz iespēju līgumos ietvertajiem euro kursa attiecībā pret ASV dolāru neitrālajiem blīvumiem 2025. gada 6. februārī. Makroekonomiskā ietekme norādīta kā vairāku ECB un Eurosistēmas speciālistu makroekonomisko modeļu vidējais rezultāts.
7. tabula
Alternatīvo valūtas kursa tendenču ietekme uz reālā IKP pieaugumu un SPCI inflāciju
1. tendence: 25. procentile | 2. tendence: 75. procentile | |||||
|---|---|---|---|---|---|---|
2025 | 2026 | 2027 | 2025 | 2026 | 2027 | |
ASV dolāra kurss attiecībā pret euro | –2.1 | –3.1 | –3.7 | 3.3 | 7.8 | 11.4 |
ASV dolāra kurss attiecībā pret euro (novirze no pamataplēses; %) | –1.1 | –1.6 | –1.9 | 1.7 | 3.9 | 5.7 |
(novirzes no pamataplēses pieauguma tempa; procentu punktos) | ||||||
Reālā IKP pieaugums | 0.0 | 0.1 | 0.1 | –0.1 | –0.2 | –0.3 |
SPCI inflācija | 0.1 | 0.1 | 0.1 | –0.1 | –0.2 | –0.3 |
Avoti: Bloomberg un ECB speciālistu aprēķini.
Piezīmes. Pieaugums nozīmē euro kursa kāpumu. 25. un 75. procentile attiecas uz iespēju līgumos ietvertajiem euro kursa attiecībā pret ASV dolāru neitrālajiem blīvumiem 2025. gada 6. februārī. Makroekonomiskā ietekme norādīta kā vairāku ECB un Eurosistēmas speciālistu makroekonomisko modeļu vidējais rezultāts.
3. ielikums
Salīdzinājums ar citu institūciju un privātā sektora prognozēm
Eurosistēmas speciālistu 2025. gada marta iespēju aplēses kopumā iekļaujas citu IKP pieauguma un SPCI inflācijas prognožu diapazonos. Speciālistu izaugsmes iespēju aplēse atbilst citu institūciju prognožu un privātā sektora speciālistu apsekojumu diapazona apakšējai robežai. Attiecībā uz SPCI inflāciju ECB speciālistu iespēju aplēses 2025. gadam par 0.2 procentu punktiem pārsniedz pārējās prognozes, kas, iespējams, skaidrojamas ar enerģijas cenu pieņēmumu atšķirībām. Attiecībā uz SPCI inflāciju 2026. un 2027. gadā un SPCIX inflāciju visā iespēju aplēšu periodā ECB speciālistu iespēju aplēses iekļaujas nelielā citu prognožu šaurajā diapazonā.
Tabula
Eurozonas reālā IKP pieauguma, SPCI inflācijas un SPCI inflācijas (neietverot enerģijas un pārtikas cenas) jaunāko prognožu salīdzinājums
(pārmaiņas salīdzinājumā ar iepriekšējā gada atbilstošo periodu; %)
| Publiskošanas datums | Reālā IKP pieaugums | SPCI inflācija | SPCI inflācija (neietverot enerģijas un pārtikas cenas) | |||||||||
|---|---|---|---|---|---|---|---|---|---|---|---|---|---|
2024 | 2025 | 2026 | 2027 | 2024 | 2025 | 2026 | 2027 | 2024 | 2025 | 2026 | 2027 | ||
ECB speciālistu iespēju aplēses | 2025. gada marts | 0.8 | 0.9 | 1.2 | 1.3 | 2.4 | 2.3 | 1.9 | 2.0 | 2.8 | 2.2 | 2.0 | 1.9 |
Consensus Economics | 2025. gada februāris | 0.8 | 0.9 | 1.2 | 1.4 | 2.4 | 2.1 | 1.9 | 2.0 | 2.8 | 2.2 | 1.9 | – |
Aptauja Survey of Professional Forecasters | 2025. gada janvāris | 0.7 | 1.0 | 1.3 | – | 2.4 | 2.1 | 1.9 | – | 2.8 | 2.2 | 2.0 | 2.0 |
Starptautiskais Valūtas fonds | 2025. gada janvāris | 0.8 | 1.0 | 1.4 | 1.3 | 2.3 | 2.1 | 2.0 | 2.0 | – | – | – | – |
OECD | 2024. gada decembris | 0.8 | 1.3 | 1.5 | – | 2.4 | 2.1 | 2.0 | – | 2.9 | 2.4 | 2.0 | – |
Eiropas Komisija | 2024. gada novembris | 0.8 | 1.3 | 1.6 | – | 2.4 | 2.1 | 1.9 | – | 2.9 | 2.4 | 2.0 | – |
Avoti: Consensus Economics prognozes, 2025. gada 13. februāris (2024. un 2025. gads, 2026. un 2027. gada dati ņemti no 2025. gada janvāra apsekojuma); ECB aptauja Survey of Professional Forecasters, 2025. gada 31. janvāris; SVF Pasaules tautsaimniecības perspektīva, 2025. gada 17. janvāris; OECD Tautsaimniecības perspektīvas, 2024. gada 4. decembris; Eiropas Komisijas 2024. gada rudens ekonomiskā prognoze, 2024. gada 15. novembris.
Piezīmes. Šīs prognozes nav tiešā veidā salīdzināmas cita ar citu vai ar ECB speciālistu makroekonomiskajām iespēju aplēsēm, jo tās nav sagatavotas vienā laikā. Turklāt to pieņēmumi par fiskālajiem, finanšu un ārējiem mainīgajiem lielumiem, t. sk. naftas, gāzes un citu izejvielu cenām, iegūti, izmantojot atšķirīgas metodes. ECB speciālistu makroekonomiskajās iespēju aplēsēs uzrādīts atbilstoši darbadienu skaitam koriģēts gada reālā IKP pieauguma temps, bet Eiropas Komisija un Starptautiskais Valūtas fonds gada pieauguma tempu uzrāda, neveicot korekcijas atbilstoši darbadienu skaitam gadā. Citās prognozēs nav norādīts, vai tajās uzrādītie dati ir vai nav koriģēti atbilstoši darbadienu skaitam.
© Eiropas Centrālā banka, 2025
Pasta adrese: 60640 Frankfurt am Main, Germany
Tālrunis: +49 69 1344 0
Interneta vietne: www.ecb.europa.eu
Visas tiesības rezervētas. Atļauta pārpublicēšana izglītības un nekomerciālos nolūkos, norādot avotu.
Konkrētu terminu skaidrojumu sk. ECB glossary (tikai angļu valodā).
HTML ISBN 978-92-899-7205-5, ISSN 2529-4512, doi: 10.2866/7226666, QB-01-25-095-LV-Q
Pēdējais datu aktualizēšanas termiņš attiecībā uz pieņēmumiem un pasaules tautsaimniecības iespēju aplēsēm bija 2025. gada 6. februāris. Makroekonomiskās iespēju aplēses eurozonai tika pabeigtas 2025. gada 19. februārī.
Ja vien nav konkrēti norādīts pretējais, atsauces uz pasaules un/vai globālajiem apkopotajiem tautsaimniecības rādītājiem šajā sadaļā neietver eurozonu.
Pēc iespēju aplēšu pabeigšanas publiskotie dati liecina, ka februārī joprojām bija vērojamas nozaru atšķirības, un apstrādes rūpniecības produkcijas izlaides IVI, neraugoties uz kāpumu attiecīgajā mēnesī, joprojām atradās sarukuma zonā. To kompensēja pakalpojumu IVI turpmāka samazināšanās, apvienotajam produkcijas izlaides IVI rādītājam februārī nemainoties (50.2).
Eurozonas fiskālo nostāju definē kā cikliski koriģētās sākotnējās bilances pārmaiņas, ko papildus koriģē, ņemot vērā NPES subsīdiju ietekmi ieņēmumu pusē. Lai gan fiskālā nostāja ir lejupējs fiskālās politikas orientācijas rādītājs, diskrecionārie fiskālie pasākumi tiek novērtēti, izmantojot augšupēju pieeju. Šie pasākumi parāda pārmaiņas nodokļu likmēs, fiskālajās tiesībās un citos valdības izdevumos, kas apstiprināti vai kas, domājams, tiks apstiprināti eurozonas valstu parlamentos.
Stingrības palielināšanās papildu avots 2025. gadā ir turpmāka atlikušo ar enerģijas cenu kāpumu saistīto atbalsta pasākumu apjoma samazināšana. Ar diskrecionārajiem pasākumiem nesaistīto faktoru pavājināšanos nosaka ieņēmumu deficīts un citas nodokļu starpības, savukārt struktūras efekti, kas 2024. gadā bija izteikti pozitīvi, gan 2025. gadā, gan pārējā iespēju aplēšu periodā, kā paredzams, būs neitrāli.
Tiek lēsts, ka NPES subsīdijas (kam nav nekādas makroietekmes uz budžeta ieņēmumu daļu) 2026. gadā būs 0.4 % no IKP un 2027. gadā – nulle (tuvu nullei).
Sk. Eurosistēmas speciālistu 2024. gada decembra iespēju aplēšu pārskata ielikumu "Novērtējums par klimata pārmaiņu pārkārtošanās politikas ietekmi uz izaugsmi un inflāciju".
Paredzams, ka minimālās algas pieaugums 2025. gadā samazināsies līdz 3.3 % (2024. gadā – 4.2 %). Tiešais mehāniskais devums kopējā algu pieaugumā 2025. gadā veido aptuveni 0.1 procentu punktu.
Gaidāms, ka ETS2 shēma tiks uzrādīta nacionālajos kontos kā ražošanas nodoklis tad, kad emisijas atļaujas tiks nodotas, t. i., gadu pēc izsoles. Tādējādi ETS2 2027. gada ieņēmumi tiks iegrāmatoti nacionālajos kontos tikai 2028. gadā, savukārt paredzams, ka galīgās cenas pieaugs jau 2027. gadā. Tādējādi gaidāms, ka bruto darbības ieņēmumi 2027. gadā īslaicīgi pieaugs.
Eurozonas importa cenu iespēju aplēsē pieņemts, ka ES tarifu politika nemainīsies. Sīkāku informāciju sk. 2. ielikumā.
Izmantotās tirgus cenas atbilst stāvoklim 2025. gada 6. februārī (pēdējais datu aktualizēšanas termiņš attiecībā uz tehniskajiem pieņēmumiem).
-
6 March 2025